
Technical Analysis
Technical Analysis: Charts, Price Action, Indicators, and Patterns
Investment Education, Research & Tools for Smarter Decisions.
It can help identify trend, momentum, volatility, liquidity, levels, participation, and invalidation. The practical objective is not to memorize isolated definitions, it's to understand the system well enough to make a documented decision, recognize what could go wrong, and select the correct next step.
Direct Answer
Technical analysis studies price and volume history to infer trend, momentum, volatility, and participation, using tools like moving averages, chart patterns, and oscillators. It works best as one input in a documented decision process, timeframe, entry trigger, invalidation point, and position size, rather than as a standalone predictor of where price goes next.
Sections in This Pillar
Each section below has its own hub page listing every guide it contains, so you can work through one topic at a time instead of scanning the full list further down.
- Candlestick Patterns: The Complete Reference: 88 guides.
- Technical Stock Screening: 15 guides.
- Momentum Indicators and Divergence: 14 guides.
- Multi-Timeframe Analysis: 12 guides.
- Support and Resistance: 12 guides.
- Volume Analysis: 12 guides.
- Chart Types: 10 guides.
- Mathematical Tools in Technical Analysis: 10 guides.
- Trend Analysis: 10 guides.
- Indicator Combinations: 9 guides.
- Volatility Indicators: 9 guides.
- Advanced Technical Analysis: 8 guides.
- Technical Risk Management: 8 guides.
- Trend Indicators: 6 guides.
- Chart Patterns: 5 guides.
- Relative Strength: 4 guides.
- Technical Strategy Applications: 3 guides.
What Technical Analysis Can Tell You
It can help identify trend, momentum, volatility, liquidity, levels, participation, and invalidation.
The goal is not to memorize indicator formulas or pattern names in isolation. It is to read price and volume together well enough to describe current market structure, define a specific invalidation level, and know when a signal has stopped confirming the read rather than reacting to every candle.
Key Takeaways
- Technical analysis answers questions about price behavior: where supply and demand have previously changed hands, whether the current move is participating broadly, and where a thesis would be wrong. It does not answer whether a business is worth owning.
- A chart is a construction, not an observation. The timeframe, the price type and the aggregation you choose all determine what the picture shows before you have read anything from it.
- Market structure is the sequence of highs and lows. Reading that sequence correctly is prerequisite to every pattern, indicator and trendline layered on top of it.
- Support and resistance are zones where prior transactions clustered, not lines with predictive power. They are useful because other participants are watching the same zones.
- Confluence means independent evidence agreeing. Three indicators derived from the same price series are not three pieces of evidence, they are one restated.
- Every technical setup needs a level at which it is wrong. Without an invalidation point you have an opinion, not a plan.
What Technical Analysis Can Answer
It can help identify trend, momentum, volatility, liquidity, levels, participation, and invalidation. Technical analysis treats price and volume history as a record of aggregate participant behavior, then uses that record to describe the current state of a market: whether it is trending or ranging, gaining or losing momentum, and where prior buying or selling interest has clustered. Because the inputs are observable and update continuously. It is well suited to questions about current market structure and to defining specific entry, exit, and invalidation points around a decision. It functions as a descriptive and risk-management tool first, not a forecasting engine.
Practical checklist
- Identify the timeframe that matches the decision (intraday, swing, or position).
- Mark the prevailing trend and the most recent significant swing high and low.
- Note where volume was elevated relative to typical activity.
- Distinguish a level that has been tested from one that is untested.
- Write down what price action would invalidate the read before it happens.
Common mistake
The common mistake is reading one chart element in isolation, a single moving average cross or one candle, and treating it as a complete market read. A trend reading, a momentum reading, and a volume reading can each say something different, and they need to be reconciled before drawing a conclusion.
What It Cannot Answer
It cannot guarantee what price will do next, and it says nothing about whether the underlying business or protocol is fundamentally sound. Technical analysis describes the past and present distribution of trades; it has no access to future order flow, so no pattern or indicator can promise where price goes next. It also cannot substitute for fundamental research, a chart can look technically strong while the underlying business is deteriorating, and a clean setup can break down instantly on news the chart itself gave no warning of. A technical read is one input among several, not a standalone thesis.

Practical checklist
- Do not treat a completed pattern as proof of what happens next.
- Do not skip fundamental or on-chain research just because a chart looks clean.
- Separate a signal's historical tendency from a guarantee of this specific outcome.
- Confirm a setup did not form only because of thin, unreliable volume.
- Assume any read can be invalidated by news the chart has not priced in yet.
Common mistake
The common mistake is upgrading a probabilistic signal into a certainty, for example, treating a textbook breakout as a guaranteed continuation instead of one outcome among several, including a false breakout that reverses within the same session.
Chart Construction
Timeframes, bars, candles, adjusted data, and session settings change what a chart shows. The same instrument can look bullish on one timeframe and bearish on another purely because of how the data is aggregated, so the bar interval, chart type, and whether price is adjusted for splits or dividends are themselves analytical choices. Candlestick charts show the open, high, low, and close for each period and make it easier to see where buyers or sellers gained control within the bar, while a line chart of closing prices strips that detail out. Session settings matter too: pre-market and after-hours activity on lower-liquidity venues can produce wicks or gaps that behave very differently from regular-session price action.
Practical checklist
- Match the bar interval to the intended holding period, not to whatever loads by default.
- Use split- and dividend-adjusted data when comparing performance over time.
- Note whether extended-hours trading is included or excluded on the chart.
- Confirm the same timeframe and settings before comparing two charts side by side.
- Re-check the chart type (candlestick, bar, line, Heikin-Ashi) before reading fine detail into a single candle.
Common mistake
The common mistake is switching timeframes mid-analysis until one of them happens to support the desired conclusion, rather than choosing a timeframe in advance and sticking to it.
Candlestick vs. Line vs. Bar Charts
A candlestick chart plots the open, high, low, and close for each period as a body with wicks, making it easy to see at a glance which side controlled the period and how far price moved beyond the close. An OHLC bar chart encodes the same four values as tick marks on a single vertical line rather than a shaded body, carrying identical information with less visual emphasis, some readers prefer it for that reason. A line chart connects only closing prices, discarding the open, high, and low; that simplicity makes broad trend direction easier to read over a long history, but it hides intraperiod volatility and the wicks many price-action reads depend on. Heikin-Ashi charts go further and average the underlying data before plotting it, which can smooth out noise and make a trend look cleaner, but the resulting candles no longer represent the literal open, high, low, and close of any single period.
Price Action and Market Structure
Swing highs, swing lows, trends, ranges, breakouts, and failed moves provide context. Market structure is built from a sequence of swing highs and swing lows: a series of higher highs and higher lows defines an uptrend, a series of lower highs and lower lows defines a downtrend, and price oscillating between a roughly stable high and low defines a range. A breakout is a move beyond a prior structural point, but it only confirms a shift in structure once price holds beyond that point rather than immediately reversing back through it, a quick reversal like that is typically called a failed breakout. Reading structure this way gives a vocabulary for describing what a chart is doing without relying on any indicator.
Practical checklist
- Label the most recent swing highs and lows before adding any indicator.
- Confirm whether the sequence of swings is trending, ranging, or transitioning.
- Wait for a close beyond a structural level before calling it a breakout.
- Watch for a quick failed move back through a broken level as a warning sign.
- Reassess structure on a higher timeframe before trading a lower-timeframe signal.
Common mistake
The common mistake is drawing trendlines and structure points after the fact to fit a preferred narrative, connecting whichever swings make the desired trend look cleanest instead of using a consistent, predefined method for marking swing points.
Trendlines and Channels
A trendline connects a series of swing lows in an uptrend or swing highs in a downtrend, and a channel adds a roughly parallel second line on the opposite side. Both help visualize the pace of a trend, but they are inherently subjective, two readers can draw slightly different lines from the same swing points, especially early on when only two or three points anchor the line. A trendline gains weight the more times price touches it and reverses without closing through it, similar to a horizontal level, and loses weight after a confirmed close through it. Because the line is drawn rather than calculated, it works best as a visual aid for structure already identified through swing highs and lows, not as a standalone signal drawn and redrawn until it produces a preferred conclusion.
Support, Resistance, and Volume
Levels are areas of prior interaction, and volume helps evaluate participation. Support and resistance mark price areas where buying or selling has previously been strong enough to slow or reverse a move, typically because orders clustered there, at a prior swing point, a round number, or a level tied to a well-known moving average. These are best treated as zones rather than exact lines, since they represent where a meaningful number of participants acted, not a single price. Volume adds context to any level or move: a breakout on rising volume suggests broader participation, while the same breakout on thin volume is more likely to fail and reverse.
Practical checklist
- Treat support and resistance as zones, not single-price lines.
- Note how many times a level has been tested, repeated tests can weaken a level.
- Compare volume on a breakout to the recent average, not to the prior single bar.
- Watch for a level that reverses role from resistance to support, or the reverse, after being broken.
- Discount a level built almost entirely on illiquid, low-volume trading.
Common mistake
The common mistake is treating every prior high or low as a hard ceiling or floor while ignoring volume entirely, when a level tested repeatedly on shrinking volume is often about to break rather than hold.
Confluence: When Multiple Signals Point to the Same Zone
Confluence describes a zone where more than one independent signal lines up, a prior swing high, a round number, and a widely watched moving average all sitting within the same narrow range, for example. A zone with confluence generally carries more weight than a level identified by a single method, since it suggests more participants are watching the same area for similar reasons. Confluence is easy to overstate, though: apply enough tools to a chart and some subset will always overlap somewhere by coincidence. It works best as a tiebreaker between comparably strong levels, decided using two or three methods chosen in advance, swing structure, round numbers, and one moving average, for example, rather than searched for after the fact to justify a level already chosen.
Indicators
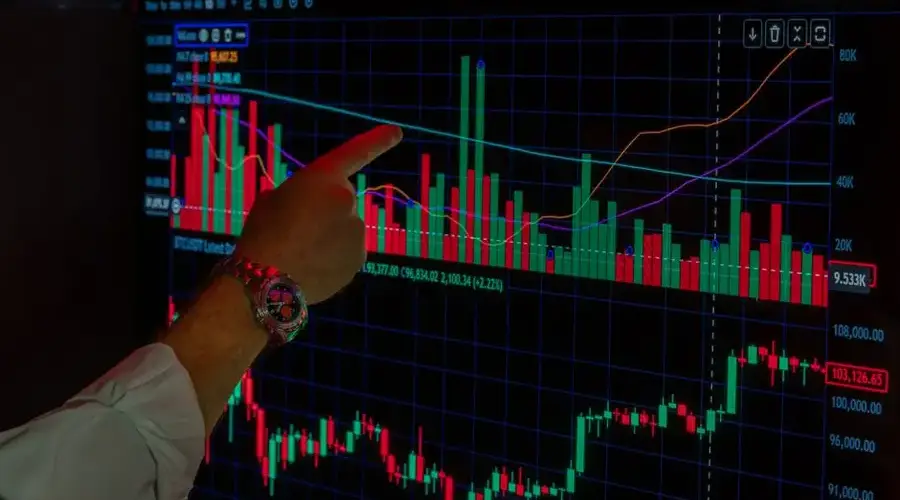
Indicators transform price or volume data and should be matched to a specific question. Indicators are mathematical transformations of price and/or volume: moving averages smooth price to show trend direction, oscillators such as RSI or stochastics measure the speed and magnitude of recent moves to gauge overbought or oversold conditions, and volume-based indicators measure participation and money flow. Because most indicators are derived from the same underlying price data, stacking several similar ones, three different momentum oscillators, for example, tends to produce redundant, correlated signals rather than independent confirmation. Matching an indicator category (trend, momentum, volatility, or volume) to the specific question being asked matters more than the number of indicators applied.
Practical checklist
- Pick one indicator per category (trend, momentum, volatility, volume) rather than several from the same category.
- Confirm what the indicator is actually calculated from before trusting its signal.
- Check the indicator's typical lag, most trend indicators confirm a move after it has started.
- Cross-reference an indicator signal against price action and structure, not in isolation.
- Review the indicator's default settings and whether they suit the chosen timeframe.
Common mistake
The common mistake is indicator stacking, adding more and more indicators expecting more confirmation, when most add correlated noise instead of independent evidence because they are built from the same price series.
Leading vs. Lagging Indicators
Indicators are commonly grouped by timing as much as by category. A lagging indicator is calculated from past price data and confirms a move already underway, most moving averages and trend-following tools fall here, reliable at identifying an established trend but slow to signal its start or end. A leading indicator attempts to anticipate a change before it is fully confirmed in price, typically by measuring the speed of recent moves, as many oscillators do. The tradeoff is direct: an indicator that reacts faster also generates more false signals, since momentum can shift briefly without the broader trend changing, while one that waits for confirmation is more reliable but gives back part of the move before signaling. Neither category is inherently better, the choice depends on whether the priority is catching a move early or avoiding false starts.
Patterns
Named patterns are useful only when context, confirmation, and invalidation are defined. Chart patterns and candlestick patterns, head and shoulders, double tops, flags, engulfing candles, and similar formations, describe recurring shapes in price that have historically preceded certain outcomes often enough to be named and studied. A pattern's reliability depends heavily on context: the same shape means different things depending on the prevailing trend, the volume accompanying it, and where it forms relative to recent structure. A pattern becomes actionable only once it has a defined confirmation trigger, such as a close beyond a specific level, and a defined invalidation point, an unconfirmed or partially formed pattern is closer to a guess than a signal.
Practical checklist
- Require a completed, confirmed pattern rather than acting on one still forming.
- Check the trend and structure the pattern is forming within, not just its shape.
- Confirm the pattern with volume where volume confirmation is typical for that pattern.
- Define the invalidation price before the pattern completes, not after.
- Note that the same pattern can resolve differently across instruments and timeframes.
Common mistake
The common mistake is pattern hunting, scanning charts until a familiar shape appears and building a trade thesis around it, instead of noting patterns only when they form within a broader, already-supported read of trend and structure.
Testing and Risk
Rules require backtesting, realistic costs, position sizing, and review. A technical rule is only as good as its track record under realistic conditions, so before relying on any setup it helps to check how it performed historically, including periods where it failed, using realistic assumptions about spread, slippage, and commissions rather than frictionless fills. Position sizing then translates that historical performance into an actual account-level decision, the same setup can be reasonable at one size and reckless at another. Periodic review matters because market conditions shift; a rule that worked well in a trending market may perform poorly once conditions turn range-bound, or the reverse.
Practical checklist
- Backtest a rule across more than one market regime, including sideways periods.
- Include realistic slippage and commission assumptions, not perfect fills.
- Size each position from a predefined maximum loss, not from conviction level.
- Track a rule's live performance against its backtested performance over time.
- Retire or revise a rule once its live results diverge meaningfully from its history.
Common mistake
The common mistake is backtesting a rule until it looks profitable, adjusting parameters after seeing the results, which produces a curve-fit rule that performed well only on the specific historical data used to build it.
Why a Backtested Rule Still Needs Forward Validation
A backtest measures how a rule would have performed on historical data, but that data is a fixed, known sample, and a rule can be tuned, deliberately or not, until it fits that sample unusually well without capturing anything durable about how the market behaves. Forward validation, sometimes called paper trading or a walk-forward test, applies the same rule to data it was not built or adjusted on, either genuinely new data as it arrives or a historical segment held out during development. A rule that performs meaningfully worse out-of-sample than in the original backtest is a warning sign that the result was partly a product of fitting to noise rather than a repeatable pattern. Because market conditions also change independent of curve-fitting, even a rule that passes forward validation benefits from ongoing review rather than being treated as permanently proven.
Worked Decision Example
Hypothetical example, for education only.
This pillar keeps insisting that confluence means independent evidence agreeing. Here is a worked case where three indicators agree and the agreement is worth nothing, because two of them are algebraically the same number.
| Input | Value |
|---|---|
| Lookback period | 14 sessions |
| Current close | $44.20 |
| Highest high over the lookback | $52.00 |
| Lowest low over the lookback | $43.50 |
Stochastic %K = 100 × (close - lowest low) / (highest high - lowest low) = 100 × ($44.20 - $43.50) / ($52.00 - $43.50) = 100 × 0.70 / 8.50 = 8.24, which reads as deeply oversold on a 0 to 100 scale.
Williams %R = -100 × (highest high - close) / (highest high - lowest low) = -100 × ($52.00 - $44.20) / 8.50 = -91.76, which reads as deeply oversold on a 0 to -100 scale.
Notice what just happened. 8.24 and -91.76 sum to 100. That is not a coincidence of these particular prices. Rearranging the two formulas gives %R = %K - 100 for any input whatsoever, so the two indicators are the same measurement shifted by a constant. A chart showing both is showing one piece of evidence twice, and a trader who counts them as two confirmations has doubled their confidence on the strength of an algebraic identity.
The same relationship holds in weaker form across most oscillators built from the same lookback window on the same price series. Genuine confluence has to come from evidence with a different input: volume behavior, the structure of the highs and lows, the position of the move relative to a prior transaction zone, or what a correlated instrument is doing. If two signals are computed from the same 14 closes, agreement between them tells you about the formula rather than about the market.
Support and Resistance Breakout Scenario
Consider a hypothetical instrument that has traded between support near $48 and resistance near $55 for several weeks, with volume during that range close to its recent average. Price closes at $56.20 on a session where volume runs meaningfully above that average, with structure already shifting to a series of higher lows into the move.
Reading the setup
- Structure: a defined ceiling near $55, now closed above it.
- Volume: elevated relative to the recent average, consistent with broader participation rather than a thin move.
- Confirmation: the close, not just an intraday wick, occurred beyond the prior resistance zone.
- Invalidation: a close back below the former resistance zone, now expected to act as support, would suggest the breakout failed.
What the setup does not confirm
- It does not confirm the move continues rather than reverses; a meaningful share of confirmed breakouts still fail.
- It does not account for pending fundamental news that could override the technical read.
- It does not by itself indicate position size, that still depends on the distance from the entry to the invalidation price and on the maximum loss the account is willing to take, worked through in Position Sizing and Risk Per Trade.
A reader following the implementation checklist would document the invalidation price before entering, size the position from that distance rather than from confidence in the move, and predefine what would need to happen to conclude the setup no longer holds, the same process whether the breakout continues or fails.
Misconceptions Versus Reality
| Misconception | Reality |
|---|---|
| Technical analysis predicts the future with certainty | It describes probabilities and current market structure, not guaranteed outcomes |
| More indicators always produce a better signal | Redundant indicators built from the same price data add noise, not confirmation |
| A chart pattern completing guarantees the expected move | A confirmed pattern still fails a meaningful share of the time |
| Technical analysis works the same on every instrument and timeframe | Liquidity, volatility, and typical participants vary by market and change reliability |
| Ignoring fundamentals is fine if the chart looks strong | A technically strong chart can break down instantly on fundamental news |
| A completed pattern or setup guarantees a win | Confirmation reduces uncertainty but does not eliminate the chance of a losing outcome |
| A trendline or indicator that worked once will keep working the same way | Market conditions change, and a tool's reliability can shift along with them |
Risks, Limitations, and Exceptions
- No indicator or pattern removes the possibility of a false signal.
- Thin or manipulated volume can produce misleading breakouts and reversals.
- Gaps, halts, and after-hours moves can invalidate a setup before it can be acted on.
- Backtested performance does not account for slippage, fees, or execution delays unless explicitly modeled.
- A signal that works well in a trending market can fail repeatedly in a range, and the reverse is also true.
- Correlated instruments can produce technical signals driven by a shared macro event rather than the instrument's own trading activity.
- Low-liquidity assets can show clean-looking patterns that are largely artifacts of few participants.
- Sudden fundamental news can override any technical level or pattern instantly.
- A rule validated only in-sample can look reliable in a backtest while having no real forward edge.
- Confluence built from several correlated tools can look like independent confirmation when the tools are not actually independent.
- A trendline or channel drawn subjectively can differ meaningfully between two readers looking at the same chart.
Practical Implementation Checklist
- Choose a primary timeframe that matches the intended holding period.
- Identify the current trend or range using recent swing highs and lows.
- Mark the nearest meaningful support and resistance zones.
- Check volume at recent turning points and breakouts.
- Add no more than one indicator per category (trend, momentum, volatility, volume).
- Look for a completed, confirmed pattern rather than an in-progress shape.
- Define the specific price that would invalidate the current read.
- Set a position size based on the distance to that invalidation price.
- Record the setup and reasoning before entering.
- Review the outcome against the original plan after the trade closes.
Conclusion
It can help identify trend, momentum, volatility, liquidity, levels, participation, and invalidation. Start with Technical Analysis Basics for a repeatable reading framework, or Price Action Explained to work directly from trends, structure, and volume without indicators.
Frequently Asked Questions
Does technical analysis work?
It works as a way to describe current market conditions and manage risk around a decision, but no indicator or pattern makes it a reliable predictor of exact future prices on its own. Its usefulness varies by market, timeframe, and how disciplined the trader is about defining invalidation before acting, it tends to add the most value paired with a clear risk plan, not used as a standalone forecast.
What is the best technical indicator?
There isn't one best indicator, because trend, momentum, volatility, and volume indicators each answer a different question and none substitutes for the others. A more useful approach is to pick one indicator from each relevant category that fits the timeframe being traded, rather than searching for a single indicator that outperforms the rest.
Is price action better than indicators?
Price action and indicators aren't competing systems, indicators are derived from price and volume, so price action is the underlying source data and indicators are one way of summarizing it. Many traders read structure and price action first to establish context, then use a small number of indicators to confirm or refine that read, rather than treating one approach as strictly superior.
How many timeframes should I use?
Most approaches use two to three timeframes: a higher timeframe to establish the prevailing trend and context, a primary timeframe that matches the actual holding period for the decision, and sometimes a lower timeframe for refining entry timing. Using more than that tends to produce conflicting signals without adding useful information.
Can chart patterns predict the future?
A chart pattern describes a historical tendency for price to behave a certain way after a similar shape has formed, not a guaranteed outcome, confirmed patterns still fail a meaningful percentage of the time. Patterns are more useful as one input for defining a specific entry, invalidation, and target than as a standalone prediction of what price will do next.
What is the difference between a candlestick chart and a line chart?
A candlestick chart plots the open, high, low, and close for each period, showing which side controlled the period and how far price moved beyond the close. A line chart connects only closing prices, which makes broad trend direction easier to read over a long history but hides intraperiod volatility and the wicks many price-action reads depend on. A line chart can be useful for a first pass at long-term trend, while a candlestick chart is generally preferred once the analysis moves to shorter-term structure and confirmation.
Does a backtested strategy need to be tested going forward too?
Yes. A backtest only shows how a rule performed on a fixed, known historical sample, and a rule can be tuned until it fits that sample unusually well without capturing anything durable about market behavior. Forward validation, applying the same rule to data it was not built or adjusted on, tests whether the original result reflects a repeatable pattern rather than a coincidence of the specific historical data used. A rule that performs meaningfully worse going forward than it did in the backtest is a sign the original edge may not have been real.
Indicator Library
Filter by category. Every indicator below has a full guide with formula, settings, signals, and worked examples.
| Indicator | Category | Leading / lagging | Standard setting | Guide |
|---|---|---|---|---|
| Simple & Exponential Moving Average | Trend | Lagging | 20 or 50 period | Full guide |
| MACD | Trend | Lagging | 12, 26, 9 | Full guide |
| ADX | Trend | Lagging | 14 period | Full guide |
| Ichimoku Cloud | Trend | Lagging | 9, 26, 52 | Full guide |
| RSI | Momentum | Leading | 14 period | Full guide |
| Stochastic Oscillator | Momentum | Leading | 14, 3, 3 | Full guide |
| Bollinger Bands | Volatility | Lagging | 20 period, 2 std. dev. | Full guide |
| Average True Range (ATR) | Volatility | Lagging | 14 period | Full guide |
| VWAP | Volume | Lagging | Session-to-date | Full guide |
| On-Balance Volume (OBV) | Volume | Leading | Cumulative | Full guide |
| Volume Profile | Volume | Lagging | Session or range | Full guide |
| Kaufman Adaptive Moving Average (KAMA) | Trend | Lagging | 10-period ER, 2/30 fast/slow | Full guide |
| Weighted Moving Average (WMA) | Trend | Lagging | Varies | Full guide |
| Hull Moving Average (HMA) | Trend | Lagging | Varies | Full guide |
| Moving Average Ribbon | Trend | Lagging | e.g. 10/20/30/40/50 | Full guide |
| Moving Average Envelope | Trend | Lagging | 2%-10% band | Full guide |
| Guppy Multiple Moving Average (GMMA) | Trend | Lagging | 3-15 / 30-60 EMA groups | Full guide |
| TRIX | Trend | Lagging | 15 period | Full guide |
| Relative Rotation / Ratio-Momentum | Trend | Lagging | Varies | Full guide |
| Fibonacci Pivot Points | Trend | Lagging | Prior period H/L/C | Full guide |
| Woodie Pivot Points | Trend | Lagging | Prior period H/L/C | Full guide |
| DeMark Pivot Points | Trend | Lagging | Prior period H/L/C/O | Full guide |
| 52-Week Position | Trend | Lagging | 52-week high/low | Full guide |
| Relative Momentum Index (RMI) | Momentum | Leading | 5-period momentum | Full guide |
| Chande Momentum Oscillator (CMO) | Momentum | Leading | 14 period | Full guide |
| Fisher Transform | Momentum | Leading | Varies | Full guide |
| Average Daily Range (ADR) | Volatility | Lagging | 14 or 20 day | Full guide |
| Rolling Volatility | Volatility | Lagging | 20 or 30 day | Full guide |
| Choppiness Index | Volatility | Lagging | 14 period | Full guide |
| Ulcer Index | Volatility | Lagging | 14 period | Full guide |
| VIX (CBOE Volatility Index) | Volatility | Leading | 30-day implied | Full guide |
| MOVE Index | Volatility | Leading | Treasury implied vol. | Full guide |
| Rolling Drawdown | Volatility | Lagging | Continuous | Full guide |
| Rolling Correlation | Volatility | Lagging | 30, 60, or 90 day | Full guide |
| Accumulation/Distribution Line | Volume | Leading | Cumulative | Full guide |
| Volume Price Trend (VPT) | Volume | Leading | Cumulative | Full guide |
| Up/Down Volume Ratio | Volume | Lagging | 10 or 50 day | Full guide |
| Volume | Volume | Lagging | Per bar/session | Full guide |
| Ease of Movement (EMV) | Volume | Lagging | 14 period | Full guide |
| Positive Volume Index (PVI) | Volume | Lagging | ~255-period MA | Full guide |
| Negative Volume Index (NVI) | Volume | Lagging | ~255-period MA | Full guide |
Best technical indicator combinations: pairing indicators without redundant signals. How to backtest technical indicators: testing rules without overfitting.
Explore More: Technical Analysis Resources
- Technical Analysis Basics: a repeatable framework for reading a price chart from the ground up.
- Technical Analysis Foundations: price and volume as data, timeframes, market structure, and the pitfalls of noise, lag, and unrealistic backtests.
- Price Action Explained: trends, support, resistance, breakouts, and volume without relying on indicators.
- Doji Candlestick Pattern: formation, meaning, and how to trade it with confirmation.
- Hammer Candlestick Pattern: small body, long lower wick, bullish reversal after a downtrend.
- Hanging Man Candlestick Pattern: same shape as a hammer, bearish reversal after an uptrend.
- Inverted Hammer Candlestick Pattern: small body, long upper wick, tentatively bullish after a downtrend.
- Shooting Star Candlestick Pattern: same shape as an inverted hammer, bearish reversal after an uptrend.
- Bullish Engulfing Candlestick Pattern: a bullish body fully engulfing the prior bearish body.
- Bearish Engulfing Candlestick Pattern: a bearish body fully engulfing the prior bullish body.
- Morning Star Candlestick Pattern: three-candle bullish reversal: sell-off, indecision, recovery.
- Evening Star Candlestick Pattern: three-candle bearish reversal: rally, indecision, breakdown.
- Three White Soldiers Candlestick Pattern: three consecutive bullish candles signaling sustained buying.
- Dark Cloud Cover Candlestick Pattern: gap-up open then a close over halfway into the prior bullish body, bearish reversal.
- Piercing Pattern Candlestick: gap-down open then a close over halfway into the prior bearish body, bullish reversal.
- Bullish Harami Candlestick Pattern: a small body fully contained within the prior long bearish body.
- Bearish Harami Candlestick Pattern: a small body fully contained within the prior long bullish body.
- Harami Cross Candlestick Pattern: a doji contained within the prior large body, a stronger harami variant.
- Spinning Top Candlestick Pattern: a small but visible body with wicks on both sides, pure indecision.
- Dragonfly Doji Candlestick Pattern: near-equal open/close near the top with a long lower wick, bullish.
- Gravestone Doji Candlestick Pattern: near-equal open/close near the bottom with a long upper wick, bearish.
- Long-Legged Doji Candlestick Pattern: near-zero body with unusually long wicks on both sides.
- Four-Price Doji Candlestick Pattern: open, high, low, and close all equal, an extreme and rare case.
- Marubozu Candlestick Pattern: a full body with no wicks, signaling one-sided control for the entire bar.
- Three Black Crows Candlestick Pattern: three consecutive bearish candles signaling sustained selling.
- Bullish Belt Hold Candlestick Pattern: opens at the low with no lower wick, closes strongly near the high.
- Bearish Belt Hold Candlestick Pattern: opens at the high with no upper wick, closes near the low.
- Tweezer Top Candlestick Pattern: two consecutive bars sharing the same high, a rejected level.
- Tweezer Bottom Candlestick Pattern: two consecutive bars sharing the same low, a defended level.
- Advance Block Candlestick Pattern: three rising candles with shrinking bodies, a bearish momentum warning.
- Bearish Abandoned Baby Candlestick Pattern: a fully gap-isolated doji between two long candles, a rare bearish reversal.
- Bearish Breakaway Candlestick Pattern: five bars: gap up, drift, then a sharp reversal back toward the gap.
- Bearish Counterattack Candlestick Pattern: a gap-up open that sells off to close matching the prior bar.
- Bearish Doji Star Candlestick Pattern: a doji gapping above a long bullish candle, an unconfirmed warning.
- Bearish Kicker Candlestick Pattern: a complete gap in the opposite direction with zero body overlap.
- Bearish Separating Lines Candlestick Pattern: matching opens across opposite-colored bars, a downtrend continuation.
- Belt Hold Candlestick Pattern: no wick at the open end, one side in control from the opening bell.
- Bullish Abandoned Baby Candlestick Pattern: a fully gap-isolated doji between two long candles, a rare bullish reversal.
- Bullish Breakaway Candlestick Pattern: five bars: gap down, drift, then a sharp reversal back toward the gap.
- Bullish Counterattack Candlestick Pattern: a gap-down open that rallies to close matching the prior bar.
- Bullish Doji Star Candlestick Pattern: a doji gapping below a long bearish candle, an unconfirmed warning.
- Bullish Kicker Candlestick Pattern: a complete gap in the opposite direction with zero body overlap.
- Bullish Separating Lines Candlestick Pattern: matching opens across opposite-colored bars, an uptrend continuation.
- Concealing Baby Swallow Candlestick Pattern: a rare four-bar bearish continuation with two marubozu bars and a failed rally.
- Deliberation Pattern Candlestick: two strong up-candles then a small body near the top, an exhaustion warning.
- Descending Hawk Candlestick Pattern: two same-colored candles, the second smaller and contained, a bearish warning.
- Downside Gap Three Methods: a gap-down continuation where a bullish bar fully fills the gap before the downtrend resumes.
- Downside Tasuki Gap Candlestick Pattern: a gap-down continuation where the fill attempt only partially closes the gap.
- Evening Doji Star Candlestick Pattern: an Evening Star variant where the middle candle is specifically a doji.
- Falling Three Methods Candlestick Pattern: three small bullish pause-candles inside a downtrend before it resumes.
- Falling Window Candlestick Pattern: a bearish price gap where no overlap exists between consecutive bars.
- Gap Side-by-Side White Lines: two similar bullish candles opening near the same price after a gap up.
- High Wave Candle Candlestick Pattern: a small body with extremely long wicks on both sides, extreme indecision.
- Homing Pigeon Candlestick Pattern: two same-colored bearish candles, the second smaller and contained, a bullish reversal.
- In-Neck Pattern Candlestick: a shallow close just above the prior bar's close, a weak bearish continuation.
- Ladder Bottom Candlestick Pattern: three declining bars, a warning bar, then a gap-up reversal.
- Long Bearish Candle: a long red body with small wicks on both ends, a momentum descriptor.
- Long Bullish Candle: a long green body with small wicks on both ends, a momentum descriptor.
- Mat Hold Candlestick Pattern: a gap-up pause within an uptrend followed by a new-high close.
- Matching Low Candlestick Pattern: two bearish bars with matching closes, a bullish reversal.
- Meeting Lines Candlestick Pattern: opposite-colored bars closing at the same price after a gap.
- Morning Doji Star Candlestick Pattern: a Morning Star variant where the middle candle is specifically a doji.
- On-Neck Pattern Candlestick: a close at the prior bar's low, the shallowest bearish continuation shape.
- Rising Three Methods Candlestick Pattern: three small bearish pause-candles inside an uptrend before it resumes.
- Rising Window Candlestick Pattern: a bullish price gap where no overlap exists between consecutive bars.
- Short Bearish Candle: a small red body, a weak/low-conviction momentum signal.
- Short Bullish Candle: a small green body, a weak/low-conviction momentum signal.
- Stalled Pattern Candlestick: two strong up-candles then a small body near the top, an exhaustion warning.
- Stick Sandwich Candlestick Pattern: matching closes on bars one and three around an opposite-colored middle bar.
- Takuri Line Candlestick Pattern: an extreme dragonfly-doji variant with an unusually long lower wick.
- Three Gaps Down Candlestick Pattern: three consecutive falling windows, a bearish-exhaustion warning.
- Three Gaps Up Candlestick Pattern: three consecutive rising windows, a bullish-exhaustion warning.
- Three Inside Down Candlestick Pattern: a Bearish Harami plus a confirming third bar closing below the first bar's low.
- Three Inside Up Candlestick Pattern: a Bullish Harami plus a confirming third bar closing above the first bar's high.
- Three-Line Strike (Bearish): three declining bars then a full engulfing bullish bar, classically read as continuation.
- Three-Line Strike (Bullish): three rising bars then a full engulfing bearish bar, classically read as continuation.
- Three Outside Down Candlestick Pattern: a Bearish Engulfing plus a confirming third bar closing lower.
- Three Outside Up Candlestick Pattern: a Bullish Engulfing plus a confirming third bar closing higher.
- Three Stars in the South: three bearish bars with shrinking range and wicks, signaling weakening selling.
- Thrusting Pattern Candlestick: a close below the first bar's body midpoint, a weak bearish continuation.
- Tri-Star (Bearish) Candlestick Pattern: three dojis, the middle one gapped above the other two.
- Tri-Star (Bullish) Candlestick Pattern: three dojis, the middle one gapped below the other two.
- Two Crows Candlestick Pattern: a gap up then two bearish bars closing deep into the first body.
- Unique Three River Candlestick Pattern: a new low via a long lower wick, then a small rally that still closes lower.
- Upside Gap Three Methods: a gap-up continuation where a bearish bar fully fills the gap before the uptrend resumes.
- Upside Gap Two Crows Candlestick Pattern: a third bar engulfing the second, closing back within an unfilled gap.
- Upside Tasuki Gap Candlestick Pattern: a gap-up continuation where the fill attempt only partially closes the gap.
- Candlestick Anatomy: How to Read a Candle: how the body and wicks encode open, high, low, and close, and why timeframe changes what a candle means.
- Why Candlestick Patterns Need Context and Confirmation: why the same shape means different things depending on trend, level, and next-bar confirmation.
- When Candlestick Patterns Fail (and Common Look-Alikes): how failed patterns show up and how to tell visually similar patterns apart.
- Candlestick Patterns: Stocks vs. Crypto Markets: how session boundaries, overnight gaps, and 24/7 trading change candlestick reads across markets.
- Market Breadth & Participation: the advance/decline line, new highs vs. new lows, TRIN, McClellan Oscillator, and more, for measuring how many stocks are participating in a move.
- Order Flow & Volume-at-Price: auction market foundations, cumulative volume delta, footprint charts, market profile/TPO, and order-flow imbalances.
- Alternative Chart Types: Heikin-Ashi, Renko, Point & Figure, Kagi, range/line-break bars, EquiVolume, swing charts, and the Elder Impulse System.
- Market Concentration & Leadership: index-weight concentration, top-5/top-10 weights, mega-cap risk, and narrow-vs-broad market leadership.
- Technical Screening: building rule-based screens for gaps, breakouts, momentum, and reversal setups.
- Momentum Indicators: RSI, MACD, stochastics, and other tools for measuring the speed and strength of a price move.
- Support & Resistance: identifying, testing, and trading key price levels, from role reversal to 52-week highs.
- Volume Analysis: how volume confirms or contradicts price moves, and the indicators built on it.
- Multi-Timeframe Analysis: aligning signals across timeframes and placing stops with a higher-timeframe view.
- Trend Indicators: the Directional Movement Index (DMI), +DI/-DI, and ADX for measuring trend direction and strength.
- Volatility: realized volatility, ATR stops, Keltner Channels, and other tools for measuring and trading price dispersion.
- Mathematical Tools: Fibonacci retracement, pivot points, linear regression, and correlation for reading price structure quantitatively.
- Relative Strength: 52-week relative strength, relative weakness, and price-relative ratio charts for comparing performance against a benchmark.
- Trend Analysis: trendlines, trend confirmation, trend exhaustion, and regime classification for reading the direction of a market.
- Indicator Combinations: how many indicators are enough, plus complementary vs. redundant pairings and signal stacking.
- Technical Strategy Applications: overlaying chart levels, volume, and volatility on known catalysts like earnings and Fed meetings.
- Technical Risk Management: setting stop-loss placement, invalidation levels, and reward-to-risk from chart structure.
- Advanced Technical Analysis: market regime detection, cointegration for pairs trading, and machine learning features from price and volume.