
Technical Analysis
Price Action Explained: Trends, Support, Resistance, Breakouts, and Volume
Investment Education, Research & Tools for Smarter Decisions.
Price action means reading a chart's own record of trades, the sequence of highs, lows, and closes, rather than leaning primarily on lagging indicators built from that same data. Here's how structure, trend, support and resistance, breakouts, and volume combine into one documented decision.
Direct Answer
Price action is the practice of reading a chart's own swings, trends, support and resistance, and breakouts to judge market conditions without relying on indicators. It works best when structure, volume, and multiple timeframes are weighed together rather than trading off any single signal, since no price-action read guarantees a favorable outcome.
What Is Price Action Trading?
Structure is the sequence of swings, trends, ranges, and failed moves defining the regime.
Price action means reading a chart's own record of trades, the sequence of highs, lows, and closes, rather than leaning primarily on lagging indicators built from that same data. The goal of this page is to build a working vocabulary for structure, trend, support and resistance, breakouts, and volume so those elements can be combined into a documented decision instead of treated as isolated buzzwords.
Key Takeaways
- Evaluate structure, trend, support and resistance, breakouts, and volume together rather than relying on any single signal.
- Begin with a defined timeframe and a maximum acceptable loss before reading the chart.
- Use volume and additional timeframes to confirm or challenge a structure-based read, not as standalone signals.
- Treat support and resistance as zones, and treat a breakout as unconfirmed until it closes and holds beyond the level.
- Write the setup criteria and invalidation price down before acting.
- No price-action framework guarantees a favorable outcome; false breakouts and failed trends happen even under sound rules.
Market Structure
Structure is the sequence of swings, trends, ranges, and failed moves defining the regime. Market structure is read by tracking swing highs and swing lows in order rather than reacting to candle-by-candle noise. A market is trending while it keeps printing swings in one direction, higher highs and higher lows, or the reverse, and is range-bound when swings oscillate between a roughly consistent ceiling and floor without net progress. A swing that breaks the established pattern of highs and lows is usually the first objective clue that the regime may be changing, though a single broken swing is not by itself proof of a new trend.
Practical checklist
- Mark the most recent confirmed swing highs and swing lows before forming an opinion.
- Classify the market as trending or range-bound based on that swing sequence, not on impression.
- Treat the first swing that breaks the established pattern as a warning, not a signal on its own.
- Check whether a structure break lines up with a support or resistance level or occurs in open space.
- Compare structure on at least one higher timeframe before acting on a lower-timeframe read.
Common mistake
The common mistake is reading structure from a single swing in isolation, for example, calling a reversal after one lower low, without checking whether that swing actually broke the prior pattern of highs and lows or was still consistent with the existing trend.
Trend
An uptrend generally produces higher highs and higher lows; a downtrend produces lower highs and lower lows. A trend is confirmed by the sequence of swing points, not by a single strong move. An uptrend needs each new swing high to exceed the prior swing high and each new swing low to hold above the prior swing low; a downtrend needs the mirror image. A trend does not end the moment price pulls back, it ends when the swing sequence itself breaks, such as a swing low forming below the prior swing low inside what had been an uptrend. Trends can also lose momentum gradually, with swings growing smaller or slower, before structure formally breaks.
Practical checklist
- Confirm at least two consecutive higher-highs-and-higher-lows (or lower-highs-and-lower-lows) swings before labeling a trend.
- Track whether each new swing makes faster or slower progress than the one before it.
- Distinguish a normal pullback within a trend from a swing that actually breaks the trend's pattern.
- Note which timeframe the trend label applies to; a pullback on a higher timeframe can look like a downtrend on a lower one.
- Reassess the trend label only after a new swing has fully formed, not mid-swing.
Common mistake
The common mistake is declaring a trend reversed after a single lower high or lower low without confirming that the swing sequence itself has actually broken, which produces frequent false reversal calls during ordinary pullbacks.
Support and Resistance
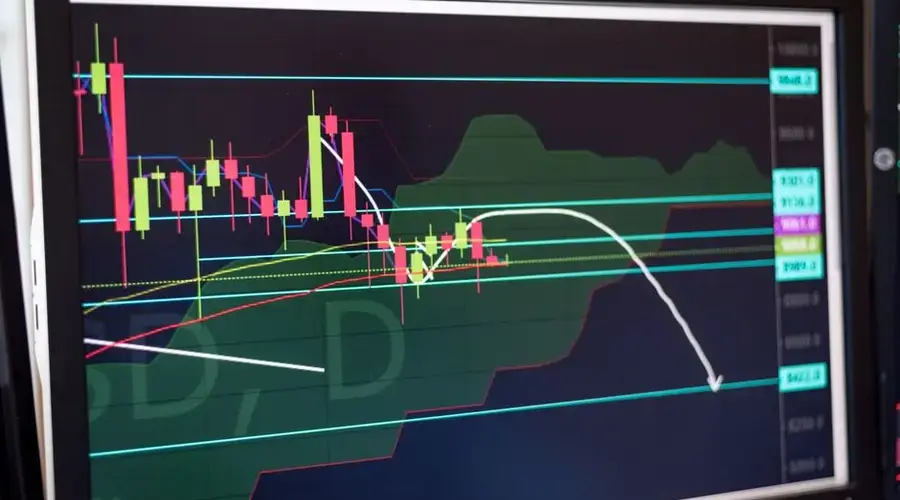
Treat levels as zones where prior supply and demand interacted, not exact guarantees. Support and resistance mark prices where buying or selling pressure previously overwhelmed the opposing side, so a wide zone generally reflects where that reaction occurred better than one exact price. Levels are strengthened by how many times price has reacted there and by the volume or time spent trading around them; a level tested repeatedly on light volume is typically weaker than one defended with clear conviction. A broken support level can later act as resistance, and a broken resistance level can later act as support, a behavior often called role reversal.
Practical checklist
- Mark levels as zones, a price range, rather than a single exact line.
- Note how many times price has previously reacted at or near the level.
- Check whether prior reactions came with above-average volume or thin, low-conviction trading.
- Watch for role reversal after a level breaks: old resistance as potential new support, and vice versa.
- Weight recent tests of a level more heavily than tests from far in the past.
Common mistake
The common mistake is treating a support or resistance level as an exact price that must hold or break precisely, rather than as a zone, which leads to premature conclusions when price wicks slightly through the level and then reverses.
Breakouts
A breakout moves beyond a defined boundary; quality depends on context, participation, follow-through, and invalidation. A genuine breakout clears a well-established support or resistance boundary with a close beyond the level, ideally with participation that exceeds recent average activity. Context matters: a breakout from a long, tight consolidation generally carries more weight than one from a boundary that only just formed. Follow-through in the bars after the breakout, price holding beyond the old level rather than immediately drifting back through it, is what separates a breakout worth acting on from one likely to fail.
Practical checklist
- Require a confirmed close beyond the level, not just an intrabar wick through it.
- Check whether volume or participation on the breakout bar exceeds the recent average.
- Favor breakouts from longer, well-defined consolidations over boundaries that just formed.
- Wait for at least one follow-through bar holding beyond the level before treating the breakout as confirmed.
- Define, in advance, the price that would invalidate the breakout if it fails.
Common mistake
The common mistake is buying or selling a breakout on the first close beyond the level with no volume or follow-through behind it, which is one of the more common ways traders get caught in a false breakout.
Failed Breakouts
A failed breakout returns through the prior boundary and can trap traders positioned for continuation. A failed breakout, sometimes called a false breakout, happens when price pushes beyond a support or resistance boundary but then reverses back through it, often trapping traders who entered expecting continuation. These failures are common near obvious, widely watched levels where many participants place similar orders, and the resulting reversal can be sharp as trapped positions are forced to exit. A failed breakout back through the level is itself informative, it can mark the start of a move in the opposite direction, since it shows the boundary was defended rather than overrun. When that reversal targets the resting orders clustered around a specific swing point, it's a liquidity sweep / swing failure pattern: a more structural, testable version of the same idea.
Practical checklist
- Define a specific invalidation price that, if reached, confirms the breakout has failed.
- Watch for a quick close back inside the prior range as an early failure signal.
- Treat obvious, heavily watched levels with extra caution given the crowding effect.
- Consider that a confirmed failed breakout can set up a trade in the opposite direction.
- Avoid adding to a breakout position until follow-through is established.
Common mistake
The common mistake is holding a breakout trade after price closes back inside the prior range, hoping the move resumes, instead of respecting the predefined invalidation point.
Volume Confirmation
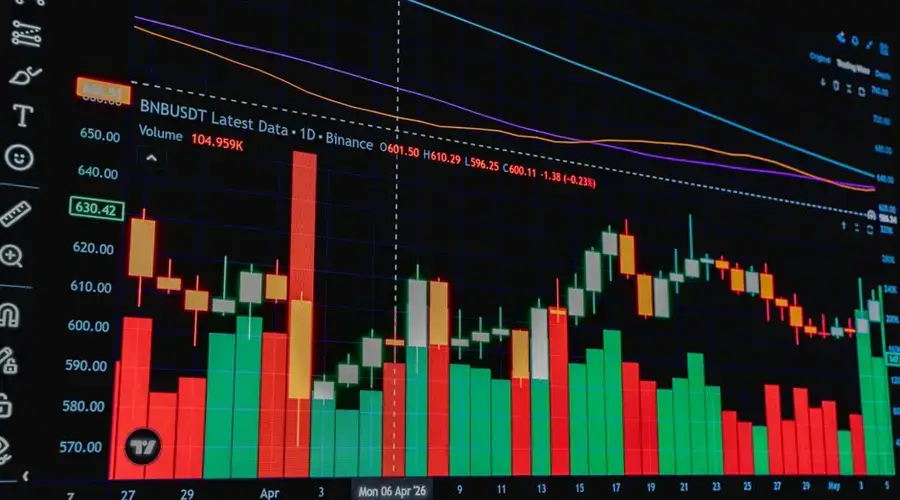
Volume can show participation, but its meaning depends on context. Volume measures how much trading activity accompanied a price move and is most useful as a relative, contextual read rather than an absolute threshold. Rising price on rising volume generally reflects broader participation and conviction behind the move, while rising price on falling volume can indicate the move is running out of committed buyers. Volume interpretation varies by instrument, thin volume on a low-liquidity asset means something different than thin volume on a heavily traded one, so it is best compared against that instrument's own recent average rather than a fixed number.
Practical checklist
- Compare volume on the move against that instrument's own recent average, not an arbitrary threshold.
- Note whether volume is expanding or contracting as a trend or breakout progresses.
- Treat a price move on unusually light volume as lower-conviction until confirmed by follow-through.
- Recognize that volume data quality and availability can vary by market and by venue.
- Use volume as one input alongside structure and level context, not as a standalone signal.
Common mistake
The common mistake is treating any volume increase as automatic confirmation of a move, without comparing it to that instrument's typical activity or considering whether the increase actually aligns with the move's direction.
Multiple Timeframes
Higher timeframes provide context while lower timeframes refine execution. Analyzing more than one timeframe helps separate the broader regime from short-term noise. A higher timeframe, such as daily or weekly, typically shows the dominant trend and the more significant support and resistance zones, while a lower timeframe, such as hourly, is used to refine entry and exit timing within that broader context. Signals that align across timeframes, for example, a lower-timeframe breakout in the direction of the higher-timeframe trend, generally carry more weight than a signal on one timeframe that contradicts the picture on a higher one.
Practical checklist
- Identify the trend and key levels on a higher timeframe before looking at a lower one.
- Use the lower timeframe only to refine timing, not to override the higher-timeframe context.
- Note when a lower-timeframe signal conflicts with the higher-timeframe trend, and treat that as added risk.
- Keep the same two or three timeframes consistently rather than switching until one supports the desired conclusion.
- Reconfirm the higher-timeframe picture periodically, since it can shift over time.
Common mistake
The common mistake is cherry-picking whichever timeframe currently supports the desired trade idea, rather than checking the higher timeframe first and using the lower timeframe only for refinement.
Objective Rules and Risk
Convert visual impressions into measurable conditions and define risk before entry. Turning a visual read of the chart into objective, written rules reduces the influence of hindsight bias and shifting justifications after the fact. That means defining in advance exactly what structure, level, or volume condition constitutes a valid setup, and defining the price at which the idea is proven wrong. Risk should be sized based on the distance to that invalidation point and the amount of capital the trader is willing to lose, not based on a profit target or a feeling of confidence in the setup.
Practical checklist
- Write the setup criteria down before the trade, not after seeing the outcome.
- Define the specific invalidation price at the same time the setup is identified.
- Size the position based on distance to invalidation and acceptable dollar risk, not on conviction.
- Decide the exit plan for both a favorable and an unfavorable outcome before entering.
- Review completed trades against the written rules rather than against the outcome alone.
Common mistake
The common mistake is defining risk after entering the trade, or moving the invalidation point once price approaches it, which turns a rules-based plan into an improvised one.
Worked Decision Example
Hypothetical example, for education only.
A change in market structure is a specific, datable event, not an impression. Reading one correctly also settles where the invalidation belongs, which is the question price action answers better than any indicator does.
The sequence on a hypothetical daily chart
- Lower highs: $118.60, then $114.20, then $110.90
- Lower lows: $112.00, then $107.40, then $104.10
- Price then rallies to $112.30, taking out the $110.90 lower high. That is the first higher high in the sequence.
- The pullback bottoms at $106.80, above the $104.10 low. That is the first higher low, and structure has flipped.
Where the invalidation actually sits
The structural read is that buyers took control at $104.10 and defended $106.80. Only the first of those two levels breaks the read. A close below $106.80 says the new higher low failed; a close below $104.10 says the downtrend never ended. If you are trading the structure change, the second level is your invalidation.
What that costs, entering on the higher-low confirmation at $108.20
- Invalidation at $104.10: risk $4.10 per share. A $500 maximum loss allows 121 shares, about $13,092 of exposure.
- Invalidation at $106.80: risk $1.40 per share. The same $500 allows 357 shares, about $38,627 of exposure.
The tighter stop looks efficient and is the more expensive mistake. It nearly triples the capital committed while placing the exit at a level the structure has not yet promised to hold, so a normal retest of the higher low closes a position that was sized as if it would not be tested at all. Structure tells you which level carries the thesis. Size follows from that level, not from how convinced you are.
Misconceptions Versus Reality
| Misconception | Reality |
|---|---|
| Price action trading means trading with no rules or indicators at all | It means prioritizing raw price, structure, and volume as the primary inputs; indicators can still serve as secondary confirmation |
| A single candle or bar reliably predicts the next move | Individual bars are noisy; the surrounding swing structure and level context matter more than any one bar |
| A support or resistance level is an exact price | Levels are better treated as zones where reactions have clustered, not a single precise number |
| Higher volume always confirms a move is genuine | Volume is only meaningful relative to that instrument's typical activity and the direction of the move |
| Once a trend is identified, it will continue until told otherwise | Trends end when swing structure breaks, and that break can happen with little advance warning |
Risks, Limitations, and Exceptions
- Support, resistance, and trend lines are subjective; two readers can draw different levels from the same chart.
- Thin or illiquid markets can produce false breakouts and unreliable volume signals more often than deep, liquid markets.
- Gaps, news events, and after-hours moves can invalidate structure without a tradable warning bar.
- Historical support or resistance behavior at a level does not guarantee the level will hold or break the same way again.
- Volume data quality and availability differ by asset class and venue, which limits cross-market comparison.
- Price action alone shows a move's visible footprint, not the underlying cause behind it.
- A short lookback window can misclassify a temporary pullback as a full trend reversal, or the reverse.
- Backtested price-action rules are sensitive to exactly how swing highs/lows and breakout confirmation are defined.
Practical Implementation Checklist
- Choose the instrument and the timeframe(s) that match the intended holding period.
- Mark recent swing highs and swing lows to establish current structure.
- Label the prevailing trend, or note that the market is range-bound.
- Identify the nearest meaningful support and resistance zones above and below current price.
- Check volume on recent moves relative to that instrument's average.
- Watch for a breakout or failed breakout at a marked level, and require a confirmed close.
- Cross-check the read against at least one higher timeframe.
- Write the specific setup criteria and invalidation price before acting.
- Size the position based on distance to invalidation and acceptable risk.
- Record the trade and the reasoning for later review against the written rules.
Conclusion
Structure is the sequence of swings, trends, ranges, and failed moves defining the regime. For the structural, testable version of a failed breakout, see Liquidity Sweeps and Swing Failure Patterns; for how price action combines with volume-based reads, see Volume Profile.
Frequently Asked Questions
What should a beginner understand about price action trading?
Start with structure: learn to identify swing highs and swing lows and use them to label a trend or a range before looking at anything more advanced. Support, resistance, breakouts, and volume all build on that foundation, so a beginner who can correctly read the current swing structure has the most important skill in place before adding complexity.
What are the largest risks in price action trading?
The largest risks are subjectivity in where levels and trend lines get drawn, false breakouts in thin or news-driven markets, and misreading a normal pullback as a full trend reversal. Because price action relies on judgment rather than a fixed formula, two readers can reach different conclusions from the same chart, which is why written, objective rules matter.
Which inputs matter most for price action trading?
The confirmed sequence of swing highs and lows, the location of the nearest support and resistance zones, and volume relative to that instrument's recent average matter most. Multiple timeframes should also be checked, since a signal that aligns with the higher-timeframe trend generally carries more weight than one that does not.
How often should price action trading be reviewed?
Structure and levels should be reassessed each time a new swing high or swing low forms, since that is when a trend or range label can change. A broader review of the written rules and past trade outcomes is separate and can happen on a regular schedule, such as monthly, to check whether the criteria are still producing the expected results.
Which Swoopr Investment tool supports price action trading?
The structure and level tool described above is intended to mark swing points, flag breakouts and failed breakouts, and compare volume against an instrument's recent average, giving a reader an objective starting point before applying their own judgment.
Does price action trading exclude indicators entirely?
Not necessarily, and practitioners sit at different points on a spectrum. The strict version reads only price and volume on a bare chart. The common version keeps a moving average or a volatility measure for context while making decisions from structure. What defines the approach is that the structure supplies the decision and any indicator is supporting rather than triggering.
What is the minimum set of concepts a price-action framework needs?
Three: a way to identify structure, so that trend and range can be distinguished; a way to identify levels, so that decisions have reference prices; and a rule that converts a level into a position size. Frameworks missing the third are chart-reading exercises rather than trading frameworks, and that is the component most often left implicit.
How is a price-action rule tested when it depends on judgement?
By writing the judgement down as conditions until it can be computed, which is usually harder than expected and is itself informative. Every place the rule resists codification is a place where two people applying it would disagree. A rule that cannot be written precisely cannot be tested, and it also cannot be reviewed against past decisions in any meaningful way.
Does price action work the same way across futures, foreign exchange and cryptocurrency?
The structural concepts transfer and the details do not. Futures have session breaks, settlement prices and roll dates that break the price series. Spot foreign exchange has no consolidated volume, so any volume-based confirmation needs a substitute. Cryptocurrency has no session boundaries or closing auction, so gap-based and close-based reasoning changes meaning. The framework carries over; its inputs do not.
Explore Price-Action Patterns
- Bear Trap: A false breakdown below support that quickly reverses higher, trapping traders who shorted the breakdown.
- Blow-Off Top: A sharp, accelerating final surge in an uptrend on heavy volume, followed by an abrupt sharp reversal down as buying exhausts.
- Breakaway Gap: A gap that occurs at the start of a new trend, breaking out of a consolidation range, usually on high volume, and is not quickly filled.
- Breakdown: Price closes below an established support level, signaling a potential new downtrend.
- Breakdown Retest: After breaking below support, price returns to retest the broken level from below (now acting as resistance) before continuing lower.
- Breakout: Price closes above an established resistance level, signaling a potential new uptrend.
- Breakout Retest: After breaking above resistance, price returns to retest the broken level from above (now acting as support) before continuing higher.
- Bull Trap: A false breakout above resistance that quickly reverses lower, trapping traders who bought the breakout.
- Capitulation Low: A sharp, high-volume final sell-off low in a downtrend where panic selling exhausts, often followed by a reversal.
- Closing-Auction Imbalance Reaction: Price movement in the final minutes before the close reacting to a publicly disclosed buy/sell order imbalance heading into the closing auction.
- Compression Into Resistance: Price makes a series of smaller-range bars with rising lows as it squeezes up against a resistance level, often preceding a breakout.
- Compression Into Support: Price makes a series of smaller-range bars with falling highs as it squeezes down against a support level, often preceding a breakdown.
- Consolidation: A period where price moves sideways within a defined range after a trend, reflecting a balance between buyers and sellers before the next directional move.
- Deep Pullback: A retracement that retraces a large portion (roughly 50-61.8%+) of the prior trend leg, testing whether the trend is still intact.
- Exhaustion Gap: A gap that occurs late in an extended trend, on climactic volume, and is quickly filled, signaling the trend is running out of momentum.
- Exhaustion Move: A sharp, high-momentum final push in a trend's direction that signals the trend is running out of participants, often preceding a reversal or sharp pullback.
- Failed Breakdown: Price breaks below support but fails to continue lower, reversing back above the level shortly after.
- Failed Breakout: Price breaks above resistance but fails to continue higher, reversing back below the level shortly after.
- Gap Fill: Price retraces to close (fill) a prior price gap, trading back through the full range that was skipped.
- Gap Rejection: Price gaps in one direction at the open but is immediately rejected and reverses to close in the opposite direction, failing to hold the gap.
- Gap Up and Gap Down: A gap up occurs when price opens above the prior bar's high; a gap down occurs when price opens below the prior bar's low, both leave an untraded price void.
- Higher Highs and Higher Lows: The defining structure of an uptrend: each swing high exceeds the prior swing high, and each swing low stays above the prior swing low.
- Horizontal Range (Trading Range): A sideways price structure bounded by a roughly flat support level below and a roughly flat resistance level above, where price oscillates between the two without a clear trend.
- Inside Bar: A bar whose entire high-low range falls within the prior bar's high-low range, signaling a contraction in volatility.
- Inside Day: A daily-timeframe inside bar: a full trading day whose high-low range is entirely contained within the prior day's range, often watched as a volatility-compression/breakout setup.
- Key Reversal Bar: A single bar that makes a new extreme in the trend direction, then closes beyond the prior bar's opposite extreme, signaling a potential sharp reversal.
- Lower Highs and Lower Lows: The defining structure of a downtrend: each swing high stays below the prior swing high, and each swing low falls below the prior swing low.
- Mean-Reversion Snapback: A sharp, fast reversal back toward a recent average/level after price has stretched unusually far away from it, often on short timeframes.
- Momentum Move: A sustained directional move characterized by consecutive same-direction bars with expanding range and volume, reflecting strong one-sided participation.
- Narrow Range 4 (NR4): A daily bar whose high-low range is the narrowest of the past four days, often watched as a volatility-compression signal ahead of a potential breakout.
- Narrow Range 7 (NR7): A daily bar whose high-low range is the narrowest of the past seven days, a stronger volatility-compression signal than NR4.
- Opening Drive: A strong, sustained directional push in the first several minutes after the open, with little pullback.
- Opening Range: The high/low established in the first few minutes after the open (commonly 5, 15, or 30 minutes), widely used as an intraday breakout reference.
- Opening Reversal: An initial post-open move that reverses direction within the same session, often trapping traders who followed the opening drive.
- Outside Bar: A bar whose entire high-low range exceeds the prior bar's range on both ends, signaling an expansion in volatility and a battle between buyers and sellers.
- Outside Day: A daily-timeframe outside bar: a full trading day whose range exceeds the prior day's range on both the high and low side.
- Parabolic Move: A price advance whose rate of increase itself accelerates over time, producing a curved, ever-steepening chart shape rather than a straight-line trend.
- Power-Hour Trend: A directional move that develops or accelerates in the final hour of the regular session (3:00-4:00pm ET).
- Premarket High and Low: The high and low prices established during premarket trading, an intraday reference level once the regular session opens.
- Previous-Day High and Low: The prior trading day's high and low prices, widely watched intraday levels that often act as support/resistance on the following day.
- Price Rejection and Acceptance: Rejection is when price tests a level and quickly reverses away (leaving a long wick), showing the market declined to trade there; acceptance is when price tests a level and continues to trade through/around it, showing the market agreed on that price.
- Pullback: A short, temporary retracement against the direction of an established trend, generally viewed as healthy trend behavior rather than a reversal.
- Resistance-to-Support Flip: Once price breaks above a resistance level, that level often becomes support on subsequent pullbacks, the level's role reverses.
- Resistance Zone: A price area where selling pressure has previously overcome buying pressure, causing price to stall or reverse down, treated as a zone rather than one exact price.
- Round-Number Level: A whole or psychologically round price (e.g. $50, $100, $150) that tends to attract clustered orders and act as informal support/resistance, even without a prior chart-based reason.
- Runaway Gap (Measuring Gap): A gap that occurs in the middle of an established trend, roughly midway through the move, and is not quickly filled, often used to estimate the move's remaining extent.
- Shallow Pullback: A retracement that retraces only a small portion (roughly 10-38%) of the prior trend leg, often read as a sign of strong trend conviction.
- Support-to-Resistance Flip: Once price breaks below a support level, that level often becomes resistance on subsequent bounces, the level's role reverses.
- Support Zone: A price area where buying pressure has previously overcome selling pressure, causing price to stall or reverse up, treated as a zone rather than one exact price.
- Swing Highs and Swing Lows: A swing high is a local peak with lower highs on both sides; a swing low is a local trough with higher lows on both sides, the basic building blocks of trend structure.
- Trend Continuation Structure: A pattern where price pauses or retraces briefly within an established trend before resuming in the same direction, confirming the trend is intact.
- Trend Reversal Structure: A pattern where the sequence of swing highs/lows breaks (e.g., an uptrend fails to make a new higher high, then breaks below the prior higher low), signaling the trend may be changing direction.
- Trend Structure: The overall pattern of swing highs and swing lows that defines whether a market is trending up, down, or sideways.
- Volatility Compression: A period where bar-to-bar trading ranges shrink noticeably, reflecting reduced volatility and often preceding a sharp expansion move.
- Volatility Expansion: A sharp increase in bar-to-bar trading range following a period of compression, often marking the start of a new directional move.
- Wide-Range Bar: A single bar whose high-low range is significantly larger than the recent average range, reflecting a burst of strong participation.