
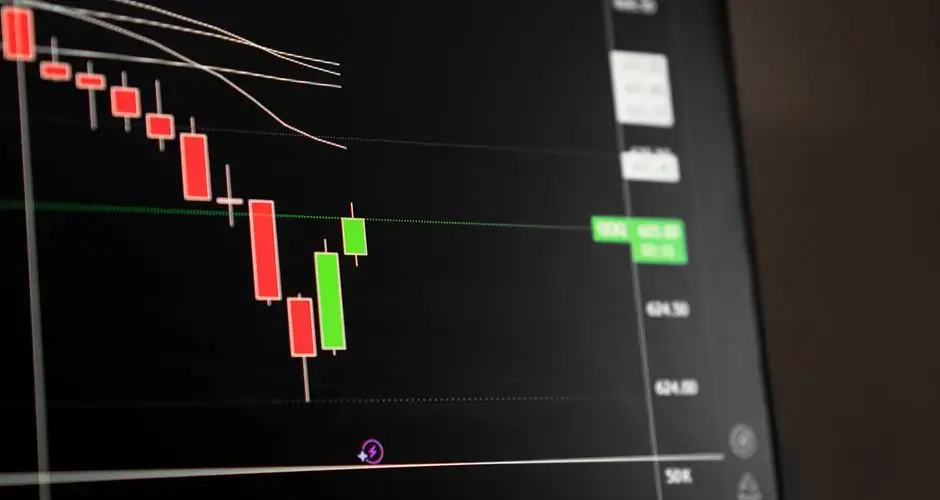
Direct Answer
A falling window is the candlestick-charting term for a bearish price gap. It forms across two bars: the second bar's entire range, from its high down to its low, sits below the entire range of the bar before it.
Key Takeaways
- A falling window is the candlestick-charting term for a bearish price gap: a bar whose entire range sits below the entire range of the prior bar.
- The gap itself, the "window", is a price zone that was never traded, since no orders were filled between the two bars' ranges.
- Appearing during a downtrend, a falling window signals a sudden acceleration of selling pressure.
- The window is treated as a resistance zone going forward: as long as price stays below it, the gap is considered a technically bearish structure.
- A close back up through the window, filling the gap, is generally read as weakening the bearish signal.
Falling Window Candlestick Pattern: Formation, Meaning, and Signals
A falling window is a bearish candlestick pattern where a bar's entire high-to-low range sits below the prior bar's entire range, leaving an empty price "window" that was never traded. It appears during a downtrend and signals a sudden acceleration of selling pressure.
What Is a Falling Window?
A falling window is the candlestick-charting term for a bearish price gap. It forms across two bars: the second bar's entire range, from its high down to its low, sits below the entire range of the bar before it. Because no trading occurred between the bottom of the first bar's range and the top of the second bar's range, that gap in price is described as a "window."
Falling windows are read in the context of a downtrend. When one appears there, it signals that selling pressure has suddenly accelerated, sellers pushed price down far enough, fast enough, that an entire untraded price zone was left behind between one bar and the next.
How a Falling Window Forms
A falling window requires the entire range of the new bar, its high and its low, to sit below the entire range of the prior bar. It isn't enough for the close to be lower, or even for the open to be lower; every price traded on the second bar must fall below every price traded on the first bar, leaving the window between the first bar's low and the second bar's high completely empty.
If the two bars' ranges overlap at all, even just the wicks touching, the gap isn't complete, and the pattern isn't a true falling window.
Falling Window Example
The chart below shows a deterministic, illustrative example: a downtrend leading in, a falling window forming, then two possible continuations, a confirmation (price stays below the window and continues lower) and a failure/look-alike (price closes back up through the window, filling the gap). Toggle between them to see why the gap alone doesn't decide the outcome.
How to Trade a Falling Window
Treat the window as resistance
The gap left behind by a falling window is treated as a resistance zone going forward. As long as price stays below the window, the gap is considered a technically bearish structure, a level that sellers are seen as continuing to defend.

Watch for a fill
A close back up through the window, filling the gap, is generally read as weakening the bearish signal. Whether the fill is partial or complete changes how much weight traders give the original gap-down move.
Common Falling Window Mistakes
- Calling any lower open a "gap", without checking that the entire range of the new bar sits below the entire range of the prior bar, a lower open alone doesn't confirm a true window.
- Counting overlapping wicks as a window, if the two bars' ranges touch or overlap at all, the gap isn't complete and it isn't a falling window.
- Ignoring whether the gap later gets filled, a filled window changes the read from bearish continuation to a weakening signal, and skipping that check misreads the pattern's current status.
Falling Window vs. Similar Patterns
| Pattern | Bar count | Key difference from a falling window |
|---|---|---|
| Falling Window | 2 | Baseline, the raw two-bar gap-down concept itself |
| Downside Gap Three Methods | 3 | Adds a third bar built around a falling window plus a fill/partial-fill attempt |
| Downside Tasuki Gap | 3 | Also a three-bar pattern built around a falling window plus a fill/partial-fill attempt |
| Rising Window | 2 | The bullish mirror image, the new bar's entire range sits above the prior bar's range |
Limitations of the Falling Window Pattern
A falling window only describes a gap between two bars' ranges, it doesn't tell you why the gap happened, how much volume traded around it, or how long the resistance zone it creates will hold. It also doesn't guarantee follow-through: price can stall right at the window, or fill it entirely on the very next bar. Like any gap-based pattern, it works best read alongside the surrounding trend and watched for whether the window gets filled, not treated as a standalone signal.
The Void Becomes the Level
The most durable thing a falling window leaves behind is not the signal, it is the zone. A band of prices where nothing traded sits above the market, and it is commonly watched as resistance on any bounce, precisely because no supply or demand was established inside it. That reference outlives the two bars that created it, and it is usually the more useful half of the pattern.
The identification is strict: the new bar entire range, wicks included, has to sit below the entire prior range. Overlapping wicks disqualify it, and comparing bodies rather than ranges is the standard misreading.
Inside a downtrend it describes selling accelerating rather than beginning, which is a continuation reading rather than a signal to enter. What produced the gap, news, an imbalance at the open, a halt, is invisible in the bars and changes what tends to follow.
And the window can be filled later. A closed gap does not retroactively unmake the pattern; it removes the level, which is the part you were using.
Falling Window FAQs
Is a falling window the same thing as a gap down?
Yes. "Falling window" is the candlestick-charting term for a bearish price gap, a bar whose entire range sits below the entire range of the prior bar, leaving an empty price zone that was never traded.
Do overlapping wicks still count as a falling window?
No. A true falling window requires the entire range of the new bar, high to low, to sit below the entire range of the prior bar. If the wicks overlap at all, the gap isn't complete and it isn't a falling window.
What happens if the gap gets filled?
A close back up through the window is generally read as weakening the bearish signal. As long as price stays below the window, the gap is considered a technically bearish structure; filling it removes that support for the bearish read.
Why does a falling window act as resistance?
The window is an empty price zone that was never traded, so no orders were filled there. Traders treat that untraded zone as a resistance area going forward, as long as price stays below it, the gap remains a bearish structure.
What's the difference between a falling window and a rising window?
They're mirror images. A falling window is a bearish gap down where the new bar's entire range sits below the prior bar's range. A rising window is the bullish equivalent, with the new bar's entire range sitting above the prior bar's range.
Why is a gap called a window in candlestick terminology?
Window is the direct translation of the Japanese term used in the original literature, where the space between two candles is described as a window that opens and later closes. Western charting arrived at gap independently for the same phenomenon. The vocabulary difference occasionally causes confusion, since closing a window and filling a gap describe the same event.
How wide does a falling window have to be?
Any separation qualifies under the strict definition, including one of a single tick, which means liquid instruments produce windows constantly and most are meaningless. Practical use requires a size threshold, usually expressed as a percentage or as a fraction of average true range. The threshold is not part of the classical definition and it is what makes the concept usable.
Do falling windows exist on continuously traded charts?
Only where trading genuinely stopped or liquidity vanished, since a window requires a price range through which nothing traded. Cryptocurrency and spot foreign exchange charts show very few. This is not a limitation of the pattern so much as a difference in market structure, and it removes a substantial part of the candlestick catalogue from those instruments.
What happens when a moving average passes through a falling window?
The average is computed from prices and knows nothing about the discontinuity, so it steps across the window as if trading had occurred there. Any rule reading price against the average therefore treats the empty range as ordinary, which it is not: no position could have been entered or exited at those prices. The two tools describe the chart on incompatible assumptions.
References
- CMT Association: Technical Analysis Body of Knowledge and Research
- CFA Institute Research and Policy Center: Investment Research
- Steve Nison, Japanese Candlestick Charting Techniques (1991), the book credited with popularizing Japanese candlestick analysis in Western markets.
- SEC Investor.gov: Introduction to Investing