
Direct Answer
The morning star is a three-bar pattern built from a specific sequence, not a single candle shape. It only qualifies as a morning star when it appears after a downtrend, the same three shapes in the middle of a sideways range or an uptrend don't carry the same reversal meaning.
Key Takeaways
- All three candles must be present together, a lone long bearish candle, a lone small-bodied candle, or a lone long bullish candle each mean something different on their own.
- The more the middle "star" candle's body stays small and gapped away from the first candle's close, the more textbook the pattern; a large-bodied or non-gapping middle candle is a weaker version.
- The pattern only carries reversal meaning after a genuine downtrend, since there is no prior selling pressure to reverse otherwise.
- It is the mirror image of the evening star, which forms after an uptrend and signals a bearish reversal instead.
Morning Star Candlestick Pattern: Formation, Meaning, and Signals
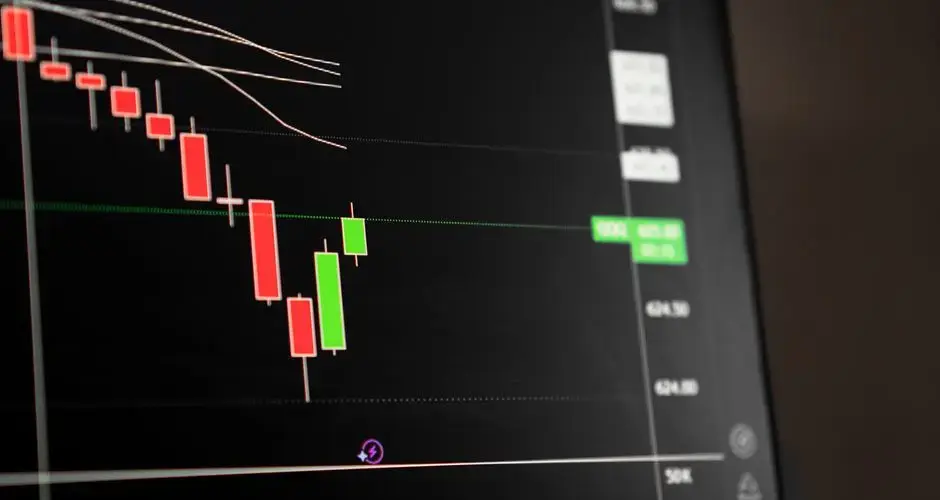
A morning star is a three-candle bullish reversal pattern that appears after a downtrend: a long bearish candle, a small-bodied "star" candle that gaps below it, and a long bullish candle that closes well back into the first candle's body. Because it shows strong selling, a pause, and then strong buying in sequence, it's considered one of the more reliable classic candlestick reversal signals.
What Is the Morning Star Pattern?
The morning star is a three-bar pattern built from a specific sequence, not a single candle shape. It only qualifies as a morning star when it appears after a downtrend, the same three shapes in the middle of a sideways range or an uptrend don't carry the same reversal meaning. The name comes from the morning star (Venus), which appears just before sunrise: the pattern is read as signaling the end of a "dark" selling phase.
What separates the morning star from simpler one- or two-candle signals is that it captures a full narrative across three bars: sellers in firm control, then a bar where neither side wins, then buyers taking control decisively enough to erase a meaningful chunk of the prior decline. That three-stage sequence is why it's treated as a stronger signal than a single bullish candle appearing at the same spot.
How Does a Morning Star Form?
The pattern is built from three candles in order:
- A long bearish body. The first candle closes well below where it opened, continuing the existing downtrend and confirming that sellers are still in control heading into the pattern.
- A small-bodied star that gaps below the first candle. The second candle's body is small, near-doji-like, and opens below the first candle's close, leaving a visible gap. This is the indecision pivot of the pattern: neither buyers nor sellers won this bar, which is what marks the shift from selling pressure to a stalemate. It is not a filler bar between the other two; its small body and gap are what make the reversal reading credible in the first place.
- A long bullish body that closes into the first candle's range. The third candle opens near the star and closes well up into the body of the first candle, often more than halfway, showing that buyers took firm control and erased a significant part of the prior decline in a single bar.
All three conditions need to be present together: a lone long bearish candle, a lone small-bodied candle, or a lone long bullish candle each mean something different on their own. It's the specific three-candle sequence, strong selling, a stall, strong buying back into the first candle's range, that defines a morning star.
Morning Star Example
The chart below shows a deterministic, illustrative example: a downtrend leading in, the three-candle morning star forming, then two possible continuations, a confirmation (price follows through higher) and a failure/look-alike (price breaks back below the star candle's low instead). Toggle between them to see why the pattern still needs confirmation before it's treated as a completed signal.
How to Trade a Morning Star
Confirm the downtrend context first
A morning star only means what it's supposed to mean when it follows a genuine downtrend. The same three-candle shape appearing after a period of sideways chop, or in the middle of an uptrend, hasn't earned the reversal reading, there's no prior selling pressure for the pattern to be reversing.

Check the star candle's gap and body size
The more the middle candle's body stays small and separated from the first candle's close, the more textbook the pattern. A middle candle with a large body, or one that doesn't gap at all, is a weaker version of the pattern and deserves less weight.
Wait for the third candle to close, then look for follow-through
The pattern isn't complete until the third candle closes well into the first candle's body. Many traders also wait for the bar after the pattern to close above the third candle's high before entering, treating the three-candle formation itself as the setup and the next bar's close as confirmation.
Set invalidation at the star candle's low
A common invalidation level is a close back below the star candle's low, that would mean the selling pressure the pattern implied had stalled has actually resumed, and the bullish read no longer holds.
Common Morning Star Mistakes
- Ignoring the trend requirement, the three-candle shape only qualifies as a morning star after a downtrend; the same bars elsewhere don't carry the same signal.
- Treating the star candle as unimportant, the middle candle's small body and gap are the mechanism behind the reversal, not a bar to skip past when reading the chart.
- Acting before the third candle closes, entering on the star candle, before the bullish third candle confirms it, skips the part of the pattern that actually signals buying control.
- Accepting a weak third candle, a third candle that only closes a small distance into the first candle's body is a much lower-conviction version of the pattern than one that closes deep into it.
Morning Star vs. Similar Patterns
| Pattern | Candle count | Key difference from a morning star |
|---|---|---|
| Morning star | Three | Baseline, long bearish, small gapped star, long bullish closing into the first body |
| Evening star | Three | The bearish mirror image, appearing after an uptrend instead of a downtrend |
| Bullish engulfing | Two | No separate indecision candle, a larger bullish body directly engulfs the prior bearish one |
| Hammer | One | A single small-bodied candle with a long lower wick, not a three-bar sequence |
| Doji | One | Describes one indecision bar in isolation, without the surrounding bearish/bullish candles that give a morning star its reversal meaning |
Limitations of the Morning Star Pattern
The morning star describes a specific three-bar price sequence, not a guarantee of what happens next. It carries no information about volume or the underlying reason for the shift in control, a morning star that formed around a scheduled earnings release or macro announcement behaves differently from one that formed on ordinary trading flow. Gaps between the three candles, expected on many exchange-traded instruments, are far less common on markets that trade nearly continuously, which can make the pattern harder to identify cleanly on some assets. Like any multi-candle pattern, it works best combined with trend context, support/resistance levels, and a defined confirmation and invalidation plan, not traded in isolation.
Three Bars That Have to Be Read Together
Each component of this pattern means something different alone. A long red candle is a strong down session. A small-bodied candle is a pause. A long green candle is a strong up session. None of them is a reversal signal, and the pattern exists because the sequence, decline, stall, recovery, describes a handover that no single bar can show. Spotting one element and anticipating the others is not reading the pattern.
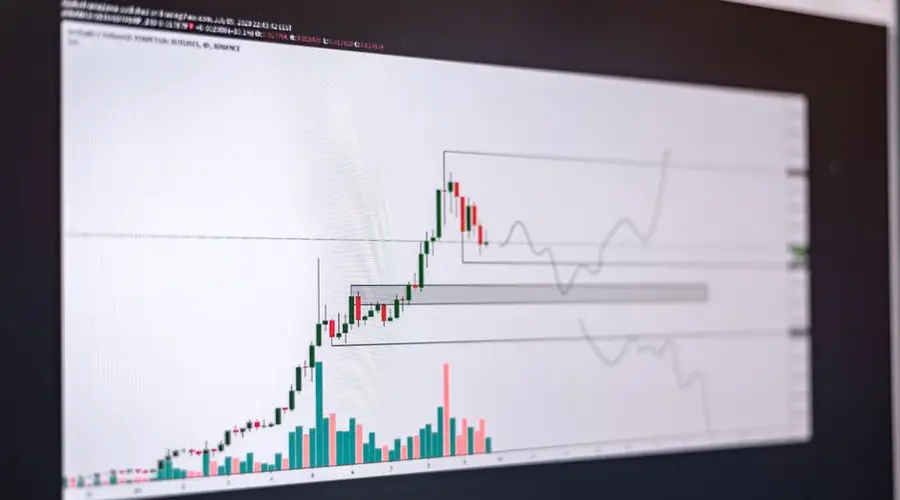
The measurable quality gate is the third bar close. How far it pushes back into the body of the first candle is what separates a decisive version from a technically qualifying one, and a third bar that barely recovers any of the decline is a weak instance regardless of the shape.
The middle candle carries the second gate. The smaller its body and the more it gaps away from the first candle close, the closer to textbook; a large-bodied or non-gapping middle bar weakens the reading even while the three-bar outline still looks right.
And a genuine downtrend has to come first. The same three shapes in a range describe a busy stretch of ordinary trading, and the reversal implication has nothing to attach to.
Morning Star FAQs
Is the morning star always a bullish signal?
It's classified as bullish because it only carries meaning after a downtrend, and its three-candle sequence describes selling exhaustion followed by buying control. The same three shapes appearing without a prior downtrend, or with a weak third candle. Don't qualify as a valid morning star.
What does the middle star candle actually mean?
The star is the pivot of the pattern, not a filler bar. Its small body and gap below the first candle show that selling pressure stalled, neither side controlled the bar, which is what makes the following bullish candle a reversal rather than just a bounce.
Does the morning star need to have a gap?
The classic definition includes a gap between the first candle's body and the star's body, and again between the star and the third candle. On markets that trade continuously with less gapping, such as many liquid stocks and crypto pairs, traders often accept the pattern with little or no gap as long as the star's body stays small and separated from the first candle's close.
How is a morning star different from a bullish engulfing pattern?
A bullish engulfing pattern is two candles: a small bearish body followed by a larger bullish body that fully covers it. A morning star is three candles, with a distinct small-bodied indecision candle in between the bearish and bullish bodies, generally considered a stronger signal because it shows an extra stage of selling exhaustion before buyers take over.
What invalidates a morning star signal?
If price closes back below the star candle's low after the pattern completes, the bullish reversal read is invalidated, the selling pressure that the pattern implied had stalled has resumed.
Does the star have to be the lowest bar of the three?
Its body has to sit below the bodies of the bars on either side, which is what makes it a star. Its low does not have to be the lowest point of the sequence, since the first candle can extend further down with a shadow. Implementations that test the lows rather than the bodies find a different and smaller set of instances.
Is the morning star related to a double bottom?
Loosely, and at a different scale. Both describe a decline stalling and reversing, and the double bottom needs two distinct lows separated by a rally, which typically spans many bars. The morning star compresses the turn into three. They are not versions of one another; a morning star can form at the second low of a double bottom, which is the two descriptions overlapping.
How does the pattern appear on a chart including the overnight session?
The gaps that define the star disappear, because the overnight trading fills the space between the sessions. What was a three-bar star pattern on a regular-session chart becomes a continuous sequence with a small bar in the middle. The pattern therefore exists on one configuration of the same instrument and not on another.
How is the preceding decline established?
From outside the three bars, since the first candle being bearish does not establish that a decline preceded it. A separate criterion is needed, whether swing structure, a moving average or a lookback return. Without one, three bars matching the shape at the start of a decline qualify as a morning star, which inverts what the pattern is supposed to describe.
References
- CMT Association: Technical Analysis Body of Knowledge and Research
- CFA Institute Research and Policy Center: Investment Research
- Steve Nison, Japanese Candlestick Charting Techniques (1991), the book credited with popularizing Japanese candlestick analysis in Western markets.
- SEC Investor.gov: Introduction to Investing