
Direct Answer
Three gaps down describes a specific sequence spanning four bars in an existing downtrend. Each of the three consecutive gap-downs is itself a falling window, a bar that opens and trades entirely below the previous bar's range, leaving an unfilled gap on the chart.
Key Takeaways
- Three gaps down is a four-bar pattern in a downtrend where three consecutive bars each gap down from the one before, forming three separate falling windows in a row.
- Because gaps rarely continue for more than three or four in the same direction, this run of consecutive gap-downs is often read as a sign the decline is becoming exhausted.
- The exhaustion read is probabilistic, not guaranteed, a fourth gap down does happen sometimes.
- Traders typically wait for the next bar to reverse back up through at least the most recent gap before treating the exhaustion signal as confirmed.
- A common mistake is miscounting overlapping-range moves as true gaps when the bars' ranges actually touch or overlap.
Three Gaps Down Candlestick Pattern: Formation, Meaning, and Signals
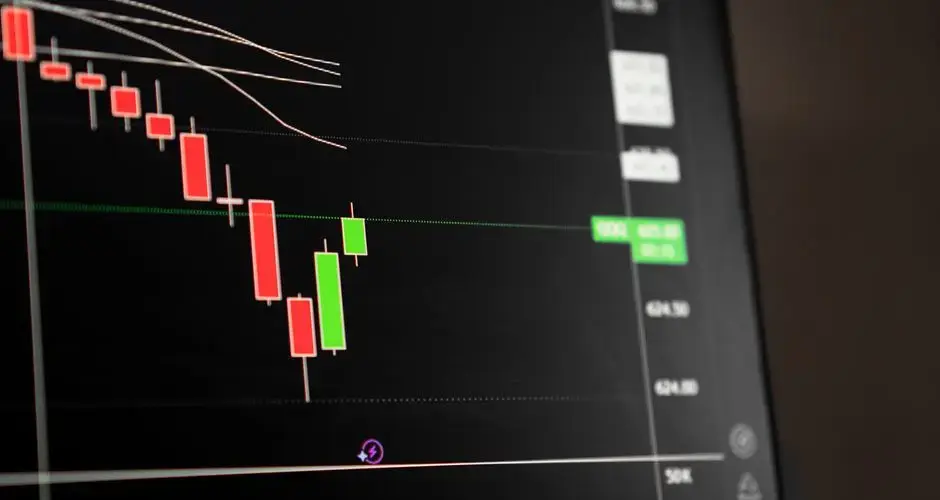
A three gaps down pattern is a four-bar sequence in a downtrend where three consecutive bars each gap down from the one before, forming three separate falling windows in a row. Because gaps rarely continue for more than three or four in the same direction, this run of consecutive gap-downs is often read as a sign the decline is becoming exhausted.
What Is a Three Gaps Down?
Three gaps down describes a specific sequence spanning four bars in an existing downtrend. Each of the three consecutive gap-downs is itself a falling window, a bar that opens and trades entirely below the previous bar's range, leaving an unfilled gap on the chart. Three of these falling windows occurring back to back is what defines the pattern.
The pattern is a description of the sequence itself, not a prediction. It doesn't say the decline is over, it identifies a run of consecutive gap-downs that traders watch for because that kind of run tends not to continue indefinitely.
How a Three Gaps Down Forms
The pattern requires three consecutive falling windows: bar two gaps down from bar one, bar three gaps down from bar two, and bar four gaps down from bar three, all within an existing downtrend. Each gap must be a true gap, the later bar's range must not overlap the earlier bar's range, rather than bars whose ranges merely touch or run close together without a real break.

Because gaps rarely continue for more than three or four in the same direction, a downtrend that has already produced three consecutive gap-downs is often read as running low on the momentum needed to keep gapping lower. That reading comes from the rarity of extended gap runs, not from any single measurement within the pattern itself.
Three Gaps Down Example
The chart below shows a deterministic, illustrative example: a downtrend leading in, three consecutive falling windows forming the pattern, then two possible continuations, a confirmation (price reverses back up through the most recent gap) and a failure/look-alike (the decline continues with a fourth gap down instead). Toggle between them to see why the pattern alone doesn't decide the outcome.
How to Trade a Three Gaps Down
Treat exhaustion as probabilistic, not guaranteed
The exhaustion read behind three gaps down is a probabilistic observation, not a guarantee, a fourth gap down does happen sometimes. Entering the moment the third gap prints skips the step that separates a real reversal from a decline that simply keeps going.
Wait for the reversal through the most recent gap
Traders watching for this pattern typically look for the next bar to reverse back up through at least the most recent gap before treating the exhaustion signal as confirmed. Without that follow-through, the three gaps down remain a description of what already happened rather than a signal to act on.
Define invalidation before acting
If the next bar instead gaps down again or continues lower without reversing through the most recent gap, the exhaustion read is invalidated for that occurrence. Deciding this threshold before the next bar closes, not after, keeps the invalidation rule honest.
Common Three Gaps Down Mistakes
- Treating three gaps down as an automatic buy signal, the pattern only describes three consecutive falling windows; it doesn't confirm a reversal without actual upside follow-through.
- Acting before the reversal confirmation, entering as soon as the third gap prints skips the check that separates a genuine exhaustion signal from a decline that continues.
- Miscounting overlapping-range moves as true gaps, bars whose ranges actually touch or overlap don't qualify as falling windows, even if price moved sharply lower.
- Ignoring the surrounding downtrend, three consecutive gap-downs only carry the exhaustion reading when they occur within an existing decline, not in an already choppy or sideways market.
Three Gaps Down vs. Similar Patterns
| Pattern | Bars | Key difference from three gaps down |
|---|---|---|
| Three Gaps Down | 4 | Baseline, three consecutive falling windows, read as bearish exhaustion |
| Falling Window | 2 | The single two-bar gap-down concept alone, without the repeated-gap exhaustion context |
| Ladder Bottom | 5 | A different five-bar bullish reversal shape, not built around consecutive gaps |
Limitations of the Three Gaps Down Pattern
Three gaps down describes a sequence of three consecutive falling windows, not a forecast. It carries no information about volume, the news or order flow driving each gap, or how far a reversal might travel if one occurs, the pattern can be followed by a fourth gap down instead of a bounce. Like any multi-bar pattern, it works best combined with trend context and a defined confirmation and invalidation plan, not used alone as a standalone buy trigger.
Runs of Gaps End, Without Saying When
The whole argument of this pattern is statistical rather than behavioural: sequences of same-direction gaps rarely run long, so three in a row suggests the decline is stretched. That is a reasonable observation about frequency and it contains no timing at all. A fourth gap down is entirely possible, and a market that has just fallen through three untraded voids is not a market that owes anyone a bounce.
Which makes this a context signal rather than an entry. It says the decline has reached an unusual state, and the evidence that the state is ending has to come from what price does next rather than from the count itself.
The counting requires whole ranges, wicks included, to clear each time. A sequence of sharply lower opens whose ranges still overlap is not three gaps, and that distinction is where most miscounts happen.
And there is a practical problem with acting on it: after three gaps down, price has already relocated a long way, so any level from the start of the sequence is far above the current market and any position taken here carries wide risk by construction.
Three Gaps Down FAQs
Is three gaps down always a bullish reversal signal?
No. Three gaps down is read as a sign the decline may be becoming exhausted, but it's a probabilistic observation, not a guarantee. A fourth gap down can still happen, so the pattern only becomes an actionable signal once the next bar actually reverses back up.
What's the difference between three gaps down and a falling window?
A falling window is a single two-bar gap-down event. Three gaps down is three of those falling windows occurring back to back across four bars, which is a much rarer and more extreme sequence than any one falling window on its own.
Why does three gaps down suggest exhaustion?
Gaps rarely continue for more than three or four in the same direction. When a downtrend has already produced three consecutive gap-downs, that run is often read as the decline running out of the momentum needed to keep gapping lower.
Does three gaps down need confirmation?
Yes. Traders watching for this pattern typically look for the next bar to reverse back up through at least the most recent gap before treating the exhaustion signal as confirmed, rather than acting on the three gaps alone.
How is three gaps down different from a ladder bottom?
A ladder bottom is a different five-bar bullish reversal shape that isn't built around consecutive gaps. Three gaps down is specifically defined by three separate falling windows in a row, not by the candle body and wick shapes a ladder bottom relies on.
Do all three gaps have to be full price gaps?
Under the strict reading yes, meaning each session must open below the previous session low with no overlap. Implementations that accept body gaps find the pattern far more often, and the sequences they find are structurally different, since price traded continuously across each supposed gap. Three genuine consecutive gaps in the same direction is an uncommon event.
What happens if a fourth gap forms?
The exhaustion reading the pattern rests on is not satisfied, and there is no established name for the extended sequence. The three-gap convention comes from the classical literature and nothing makes three the threshold. A fourth or fifth gap simply means the decline continued, which is a reminder that the count is a convention rather than a measured limit.
How is the pattern distinguished from an ordinary run of down sessions?
Entirely by the gaps. Three consecutive down candles are common; three consecutive sessions each opening below the previous session low are not. The gaps are what indicate that each new session began by repricing lower rather than by continuing from where the last ended, which is the acceleration the exhaustion reading depends on.
Does the sequence have a Japanese name?
The three-gap concept appears in the Japanese literature as sanku, and it is discussed as a rule of thumb about advances or declines running for three gaps before stalling. The English pattern name is a direct rendering of that. As with the count itself, the rule is a traditional convention rather than a measured regularity.
References
- CMT Association: Technical Analysis Body of Knowledge and Research
- CFA Institute Research and Policy Center: Investment Research
- Steve Nison, Japanese Candlestick Charting Techniques (1991), the book credited with popularizing Japanese candlestick analysis in Western markets.
- SEC Investor.gov: Introduction to Investing