
Direct Answer
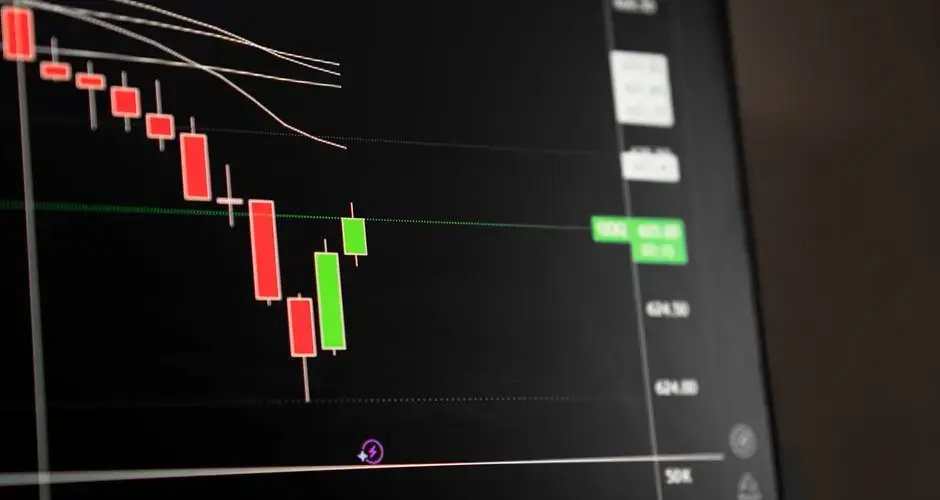
A Tweezer Bottom is the mirror image of a Tweezer Top. Where a Tweezer Top forms after an uptrend with two bars sharing the same high, a Tweezer Bottom forms after a downtrend with two consecutive candles sharing, or very nearly sharing, the exact same low price.
Key Takeaways
- A Tweezer Bottom is a two-bar pattern appearing after a downtrend, in which two consecutive candles share, or very nearly share, the exact same low price.
- The first bar is typically bearish, continuing the prevailing downtrend; the second bar reverses higher, closing well above where it opened, but bottoms at essentially the same low as the first bar.
- The matching lows mark a specific price level where selling pressure was rejected on two separate occasions in a row.
- Only the lows need to match closely, the two bars' bodies, opens, and closes can differ substantially.
- It's a relatively weak signal on its own compared to a full Bullish Engulfing or Piercing Pattern, so it's typically combined with other confirmation before acting.
Tweezer Bottom Candlestick Pattern: Formation, Meaning, and Signals
A Tweezer Bottom is a two-bar bullish reversal pattern in which two consecutive candles bottom out at nearly the same low after a downtrend. The first bar typically continues the downtrend, while the second reverses higher but stops at essentially the same low, marking a level where sellers were rejected twice in a row.
What Is a Tweezer Bottom?
A Tweezer Bottom is the mirror image of a Tweezer Top. Where a Tweezer Top forms after an uptrend with two bars sharing the same high, a Tweezer Bottom forms after a downtrend with two consecutive candles sharing, or very nearly sharing, the exact same low price.
The pattern's significance comes from that matching low. When two separate bars, formed at two separate points in time, both bottom at the same price, it suggests that level attracted enough buying interest to stop the decline twice in a row, a specific, defended price rather than a vague area.
How a Tweezer Bottom Forms
The first bar in the pattern is typically bearish, continuing the prevailing downtrend into a new low. The second bar then reverses higher, closing well above where it opened, but critically, it bottoms at essentially the same low as the first bar rather than breaking meaningfully below it.
Only the lows need to match closely for the pattern to qualify. The two bars' bodies, opens, and closes can differ substantially: the first bar might have a large bearish body while the second has a smaller or larger bullish body, and the pattern still holds as long as the low-price rejection lines up.
Tweezer Bottom Example
The chart below shows a deterministic, illustrative example: a downtrend leading in, the two matching-low bars forming, then two possible continuations, a confirmation (price follows through higher) and a failure/look-alike (price breaks below the shared low instead). Toggle between them to see why the matching lows alone don't decide the outcome.
How to Trade a Tweezer Bottom
Treat it as a weak signal alone
Like its bearish counterpart, a Tweezer Bottom alone is a relatively weak signal compared to a full Bullish Engulfing or Piercing Pattern, it flags a defended level rather than a decisive shift. It's typically combined with other confirmation before acting, rather than traded on its own.
Look for the level, not just the shape
What matters most is that the two lows genuinely line up. A vague two-bar bounce near a low isn't the same as a Tweezer Bottom, the value of the pattern comes specifically from the price rejection repeating at the same level.
Confirm with context
Combining a Tweezer Bottom with the surrounding trend, a known support level, or a following bar that closes higher gives the matching-lows signal more weight than reading it in isolation.
Common Tweezer Bottom Mistakes
- Treating any two-bar bounce near a low as a Tweezer Bottom without the lows actually matching closely, a rough resemblance isn't the same as a genuine repeated rejection.
- Over-weighting it as a standalone signal, it's a weaker signal than a full Bullish Engulfing or Piercing Pattern and usually needs additional confirmation.
- Ignoring that only the lows need to match, not the bodies or opens, dismissing a valid Tweezer Bottom because the two bars' bodies look different is a common error.
Tweezer Bottom vs. Similar Patterns
| Pattern | Bars | Key difference from a Tweezer Bottom |
|---|---|---|
| Tweezer Bottom | 2 | Baseline, matching LOWS across two consecutive bars, second bar reverses higher |
| Tweezer Top | 2 | Matching HIGHS instead of lows, the bearish mirror of a Tweezer Bottom |
| Bullish Engulfing | 2 | Second body fully engulfs the first; no requirement for matching lows |
| Dragonfly Doji | 1 | Single-bar rejection of lower prices via wick shape, not two-bar level matching |
Limitations of the Tweezer Bottom Pattern
A Tweezer Bottom only shows that two consecutive bars bottomed at essentially the same price, it doesn't tell you the strength of the buying interest at that level, the volume behind either bar, or whether the reversal will extend beyond a bounce. It's a weaker signal than a full Bullish Engulfing or Piercing Pattern precisely because it flags a defended level rather than a decisive shift in control. Like any pattern built on matching price levels, it works best combined with trend context and a defined confirmation plan, not used alone.
Matching Lows Often Mean a Shared Level
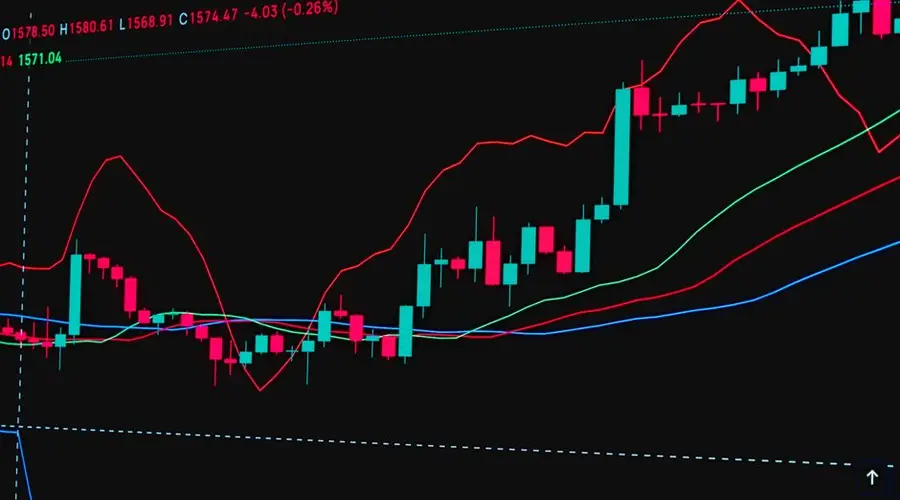
Two consecutive bars stopping at the same price is frequently less mysterious than it looks. Round numbers, prior swing lows and widely watched moving averages all attract orders at a specific price, so two sessions ending their declines there is the level doing its job rather than a special two-bar formation. That does not weaken the observation, and it does mean the pattern and the level are the same information.
Which suggests looking at what is at that price before reading anything into the pattern itself. A tweezer bottom sitting on a level that has held before is a coherent, mutually supporting read. One in open space is two bars that happened to stop together.
The tolerance question applies here as with the top: nothing defines how near-identical the lows must be, so a stated threshold, ideally relative to the bar range, keeps the identification consistent.
And the second bar has to do the work. Matching lows with a second session closing weakly describes continued selling that happened to stop at the same place; the pattern wants the second bar to turn and close well up from the low.
Tweezer Bottom FAQs
Is a Tweezer Bottom always a strong bullish signal?
No. On its own, a Tweezer Bottom is a relatively weak signal compared to a full Bullish Engulfing or Piercing Pattern, it flags a defended level rather than a decisive shift, so it's typically combined with other confirmation before acting.
What makes two candles a Tweezer Bottom?
Two consecutive candles that share, or very nearly share, the exact same low price after a downtrend. The first bar is typically bearish, continuing the trend, and the second bar reverses higher but bottoms at essentially the same low as the first.
Do the open and body sizes need to match in a Tweezer Bottom?
No. Only the lows need to match closely. The two bars' bodies, opens, and closes can differ substantially, the pattern is defined entirely by the matching low price, not by body shape or size.
What's the difference between a Tweezer Bottom and a Tweezer Top?
A Tweezer Bottom has two consecutive bars with matching lows after a downtrend, signaling a possible bullish reversal. A Tweezer Top is its bearish mirror image, two consecutive bars with matching highs after an uptrend.
How is a Tweezer Bottom different from a Dragonfly Doji?
A Dragonfly Doji is a single-bar pattern that shows rejection of lower prices through its wick shape on one candle. A Tweezer Bottom is a two-bar pattern that shows the same rejection through two separate candles bottoming at the same level.
How exactly must the two lows match?
A tolerance is required, since two sessions reaching exactly the same low is uncommon in finely quoted instruments. Implementations allow a band expressed as a fraction of the bar range or of average true range. That band is the main determinant of how many tweezer bottoms a chart contains, and it is rarely stated by the platform drawing them.
Do the two candles have to be adjacent?
Most definitions require them to be consecutive, and some allow one or two bars between as long as the matching lows are the extremes of the structure. The relaxed version admits far more instances and weakens the observation, since two matching lows several sessions apart is a different thing from two consecutive sessions stopping at the same price.
Does a coarse tick size make a tweezer bottom less meaningful?
Considerably. Where few prices are available, two sessions reaching the same low is unremarkable and can happen by arithmetic rather than by any level being defended. The pattern rests on the coincidence being unusual, so in an instrument quoted in large increments the coincidence is routine and the observation loses its content.
How does a tweezer bottom relate to a double bottom?
They describe the same idea at very different scales. A double bottom is a chart formation spanning many bars, with a rally between the two lows and a defined neckline. A tweezer bottom compresses the concept into two adjacent bars with no intervening structure. The chart formation carries considerably more information; the candlestick version is faster to identify and thinner in evidence.
References
- CMT Association: Technical Analysis Body of Knowledge and Research
- CFA Institute Research and Policy Center: Investment Research
- Steve Nison, Japanese Candlestick Charting Techniques (1991), the book credited with popularizing Japanese candlestick analysis in Western markets.
- SEC Investor.gov: Introduction to Investing