
Direct Answer
A simple moving average (SMA) averages a fixed number of past prices with equal weight. An exponential moving average (EMA) averages the same prices but weights recent ones more heavily, so it reacts to new price changes faster and lags price less than an SMA of the same length, at the cost of reacting to short-term noise more often.
Key Takeaways
- SMA = sum of closing prices over N periods ÷ N; EMA weights the most recent close using a multiplier of 2 ÷ (N + 1).
- A shorter period reacts faster but produces more whipsaws in a range; a longer period is smoother but confirms trend changes later.
- Golden crosses (short MA above long MA) and death crosses (the reverse) are lagging signals, the crossover happens after the trend shift that caused it.
- In a trend, price sometimes bounces off a moving average like support or resistance; this tendency weakens in a sideways range.
- Period length and SMA-vs-EMA weighting are independent choices, a 20-period EMA reacts faster than a 20-period SMA, but slower than a 9-period EMA.
What Is the Difference Between SMA and EMA?
A simple moving average (SMA) averages a fixed number of past prices with equal weight. An exponential moving average (EMA) averages the same prices but weights recent ones more heavily, so it reacts to new price changes faster and lags price less than an SMA of the same length, at the cost of reacting to short-term noise more often.
The Formulas
SMA = (Sum of closing prices over N periods) ÷ N. Each of the N prices counts equally, whether it happened yesterday or N days ago.
EMA today = (Close today × multiplier) + (EMA yesterday × (1 − multiplier)), where multiplier = 2 ÷ (N + 1). The first EMA value in a series is typically seeded with an SMA of the first N prices, then the formula above is applied going forward.
The multiplier is what makes EMA "exponential": for a 10-period EMA, the multiplier is 2 ÷ 11 ≈ 0.182, so today's close gets about 18.2% of the weight and yesterday's EMA (which itself carries the weighted history of every prior price) gets the rest. A shorter period produces a larger multiplier and a faster-reacting line; a longer period produces a smaller multiplier and a smoother line.
Worked Example
Hypothetical example, for education only.
Five days of closing prices: $100, $102, $101, $104, $106. A 5-period SMA on day 5:
SMA = (100 + 102 + 101 + 104 + 106) ÷ 5 = 513 ÷ 5 = $102.60
For a 5-period EMA, the multiplier is 2 ÷ (5 + 1) = 0.333. Seed day 3's EMA with the 3-day SMA of the first three closes: (100 + 102 + 101) ÷ 3 = $101.00. Then roll forward:
| Day | Close | EMA calculation | EMA |
|---|---|---|---|
| 3 | $101 | Seed (3-day SMA) | $101.00 |
| 4 | $104 | (104 × 0.333) + (101.00 × 0.667) | $102.00 |
| 5 | $106 | (106 × 0.333) + (102.00 × 0.667) | $103.33 |
On day 5, the SMA reads $102.60 and the EMA reads $103.33, the EMA sits closer to the most recent close ($106) because it weighted the last two up days more heavily, while the SMA still gives full weight to day 1's $100.
Common Moving-Average Signals
Price crossing the moving average
Price closing above a rising moving average is commonly read as a bullish trend signal; closing below a falling one, bearish. In a sideways market, price can cross a moving average repeatedly, producing frequent, low-value signals.
Golden cross and death cross
A golden cross is a shorter-period average (commonly the 50-day) crossing above a longer-period average (commonly the 200-day), often read as a bullish longer-term signal. A death cross is the same crossover in reverse, often read as bearish. Both are lagging by construction: the crossover can only happen well after the underlying trend shift that caused it.
Moving average as dynamic support or resistance
In a trending market, price sometimes pulls back to a moving average and bounces, treating the line as approximate support (in an uptrend) or resistance (in a downtrend). This tendency is more reliable in a clear trend and less reliable in a range, where the average sits inside the noise.
Choosing a Period Setting
| Period | Responsiveness | Common use | Trade-off |
|---|---|---|---|
| 9-10 | Fast | Short-term/intraday trend | More whipsaws in a range |
| 20 | Moderate | Swing trading trend reference | Still reacts to short pullbacks |
| 50 | Slower | Intermediate trend, golden/death cross (short leg) | Lags sharp reversals |
| 100 | Slow | Longer intermediate trend | Confirms trend changes late |
| 200 | Very slow | Long-term trend, golden/death cross (long leg) | Large lag after a reversal |
SMA and EMA can each use any of these periods, the period controls how much history is smoothed, while SMA vs. EMA controls how that history is weighted. A 20-period EMA reacts faster than a 20-period SMA; a 50-period SMA reacts slower than a 20-period EMA. The two choices are independent.
Two separate knobs affect how a moving average behaves at a given time horizon: the period length sets how much history is smoothed (shorter periods track a shorter horizon and lag less in absolute time, but pick up more short-term noise), and the SMA-versus-EMA choice sets how that history is weighted (EMA lags less than an SMA of the identical period, at the cost of reacting to more short-term noise within that same window). A short EMA and a short SMA both suit a short time horizon, but the EMA will still be the more responsive, noisier of the two; the same relationship holds at a long time horizon between a long EMA and a long SMA. Choosing a horizon and choosing an averaging method are independent decisions, not the same choice made twice.
Common Mistakes
- Assuming EMA is always better because it's faster, faster also means more false signals in a choppy market.
- Treating a single MA cross as a full trading system, moving averages lag by construction and work best combined with price structure or another indicator category.
- Ignoring the timeframe mismatch, a 50-period average means something different on a 5-minute chart than on a daily chart.
- Expecting a golden/death cross to call the exact top or bottom, both signals confirm a shift that has usually already been underway for some time.
- Switching periods after every losing signal, repeatedly re-optimizing to fit recent price action tends to fit noise, not a durable edge.
Limitations
Both SMA and EMA are lagging by construction, they're calculated from prices that have already happened, so neither can flag a reversal before it starts. Moving averages also don't distinguish a low-volume drift from a high-conviction move; two identical average readings can sit behind very different volume and liquidity conditions.
Choosing a Moving Average You Can Live With
The decision this guide is meant to settle is not SMA or EMA. It is two decisions that get habitually collapsed into one: how much history to smooth (the period) and how to weight that history (simple or exponential). A 20-period EMA reacts faster than a 20-period SMA and slower than a 9-period EMA. Choose the horizon first, then choose the weighting, and the selection stops feeling arbitrary.
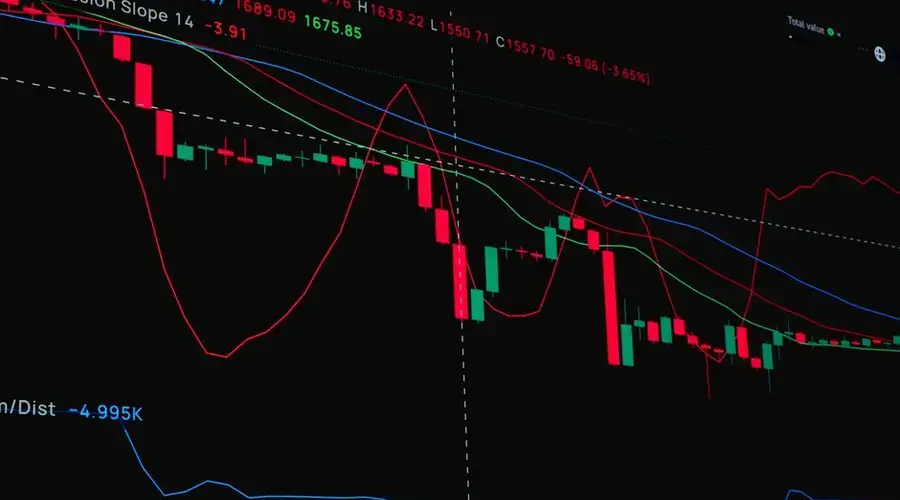
The mistake the EMA invites is assuming faster is better. Faster means the line turns sooner on genuine reversals and just as promptly on noise, and in a sideways market that difference shows up as a run of crossings that each looked like a signal at the time. The golden cross invites a different mistake: expecting a 50/200 crossover to mark a turning point. By construction it can only appear after the shift that produced it, sometimes long after.
Two checks are worth making before acting on any moving-average signal. First, translate the period into real time on your chart, because 50 bars is roughly ten weeks on a daily chart and a little over four hours on a 5-minute chart, and the same number represents a very different commitment in each. Second, confirm price has actually been trending, since the dynamic support and resistance behaviour attributed to moving averages fades in a range where the line simply sits inside the noise.
The habit worth resisting is re-optimising after every losing signal. Shortening or lengthening the period to fit the last few weeks of price action fits the noise in that sample, not something durable, and the newly chosen setting arrives already fitted to a market that has moved on.
Moving Average FAQs
What is the difference between SMA and EMA?
SMA weights every price in the lookback period equally. EMA weights recent prices more heavily, so it reacts faster to new price changes and lags price less than an SMA of the same length.
Is EMA better than SMA?
Neither is universally better. EMA's faster reaction can catch trend changes sooner but also produces more whipsaws in a choppy market. SMA's smoother line filters more noise but confirms trend changes later.
What is a golden cross and a death cross?
A golden cross is a shorter-period moving average crossing above a longer-period moving average, commonly the 50-day crossing above the 200-day, often read as a bullish long-term signal. A death cross is the reverse, often read as bearish. Both are lagging signals.
What moving average period should I use?
There's no single correct period. Shorter periods like 9 or 20 react faster and suit shorter-term trading; longer periods like 50, 100, or 200 smooth more noise and are commonly used to judge the longer-term trend.
Should day traders use EMA and long-term investors use SMA?
Not as a strict rule. Time horizon mainly drives the period length (shorter periods like 9-20 for intraday and swing trading, longer periods like 50-200 for position trading and long-term trend reads), while the SMA-versus-EMA choice is a separate, independent decision about how much weight to put on the most recent prices at any of those horizons. A day trader can use a 20-period SMA, and a long-term investor can use a 200-period EMA; the period controls the time horizon, the averaging method controls responsiveness within it.
Do moving averages work the same way for crypto?
The calculation is identical. Crypto's continuous, 24-hour trading means a daily moving average always closes at midnight UTC rather than a market close, and higher volatility can produce more frequent crossovers than the same setting on a stock.
What does it mean when a stock crosses its 200-day moving average?
The 200-day simple moving average is widely watched as a long-term trend dividing line. When a stock's price crosses above its 200-day SMA. It is often interpreted as a bullish signal, the stock may be transitioning from a downtrend to an uptrend. A cross below is treated as bearish. These crossovers matter partly because many institutional investors and algorithmic systems use the 200-day as a reference point, creating a self-reinforcing effect around the level. Volume and the broader market context should be considered before acting on the signal alone.
What is a weighted moving average and where does it sit between the two?
A weighted moving average assigns linearly declining weights across a fixed window, so recent bars count more and anything outside the window counts not at all. That places it between the two in responsiveness: faster than a simple average because of the weighting, and unlike an exponential average it discards old data completely rather than retaining a diminishing influence indefinitely.
Does an average of an average behave like one longer average?
Not identically. Applying a second smoothing produces a line that is smoother than a single average of the equivalent total length and lags differently, because the two stages compound rather than add. Double-smoothed constructions are used precisely for that character. Substituting a single longer average is a reasonable approximation of the delay and not of the shape.