
Direct Answer
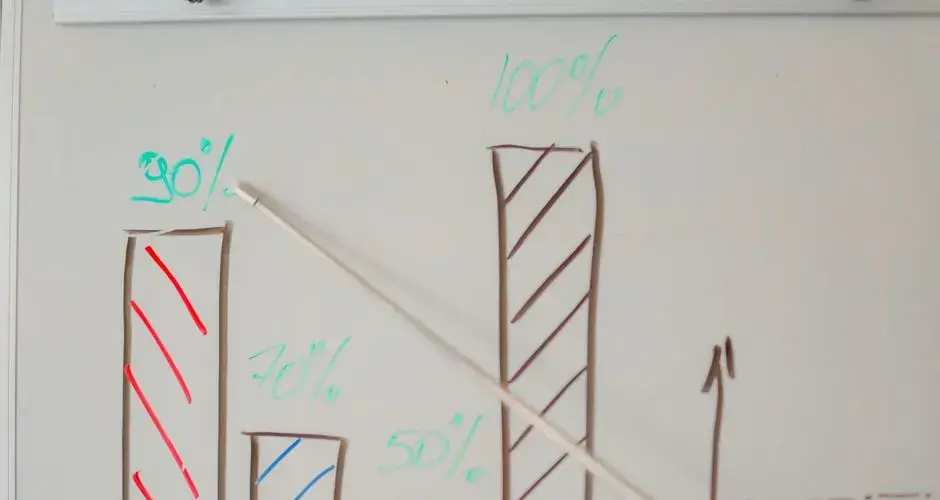
52-Week Position shows where an asset's current price sits relative to its own trading range over the trailing 52 weeks, expressed as a percentage: 100% means the price is at its 52-week high, 0% means it's at its 52-week low. The formula is (Current Price − 52-Week Low) ÷ (52-Week High − 52-Week Low) × 100, and the same reading is used two opposite ways, momentum strategies commonly favor a high position, contrarian strategies commonly favor a low one.
Key Takeaways
- 52-Week Position (%) = (Current Price − 52-Week Low) ÷ (52-Week High − 52-Week Low) × 100.
- 100% means the price is at its 52-week high; 0% means it's at its 52-week low.
- It's used both as a momentum screen (near-high favored) and a mean-reversion screen (near-low favored), two conflicting uses of the same number, both real.
- It says nothing about trend direction, volume, or why the range formed, only where price sits inside it right now.
What Is 52-Week Position?
52-Week Position is an indicator showing where an asset's current price sits relative to its own trading range over the trailing 52 weeks. Instead of looking at the 52-week high and low as two separate reference points, it compresses them into a single percentage that answers one question: out of the full range this asset has traded in over the past year, how much of that range has the current price climbed?
A reading near 100% means price is trading at or near its highest point of the past year. A reading near 0% means it's trading at or near its lowest point. A reading near 50% means price sits roughly in the middle of its trailing 52-week range, it doesn't mean the asset is "neutral" or fairly valued, only that it's positioned midway between its own recent extremes.
Key takeaways: 52-Week Position (%) = (Current Price − 52-Week Low) ÷ (52-Week High − 52-Week Low) × 100. 100% means the price is at its 52-week high; 0% means it's at its 52-week low. It's used both as a momentum screen (near-high favored) and a mean-reversion screen (near-low favored), two conflicting uses of the same number, both real. It says nothing about trend direction, volume, or why the range formed, only where price sits inside it right now.
The Formula
52-Week Position (%) = (Current Price − 52-Week Low) ÷ (52-Week High − 52-Week Low) × 100.
| Component | Definition | Why it matters |
|---|---|---|
| 52-Week High | The highest price the asset has traded at over the trailing 52 weeks. | Defines the top of the range and the 100% reference point. |
| 52-Week Low | The lowest price the asset has traded at over the trailing 52 weeks. | Defines the bottom of the range and the 0% reference point. |
| Current Price | The asset's latest traded price. | The numerator moves every session; the high and low update only when a new extreme is set. |
| Result | A percentage from 0% to 100%. | 100% = at the 52-week high; 0% = at the 52-week low. |
Both the 52-week high and 52-week low are themselves trailing, already-realized prices, so the whole calculation is backward-looking by construction, it describes where price has traded relative to itself, not where it's headed next. As with any indicator, verify exactly how your platform defines the 52-week window (calendar weeks vs. trading days, intraday extremes vs. closing prices) before comparing readings across different charting tools.
Worked Example
A stock has a 52-week high of $180 and a 52-week low of $120. It's currently trading at $156.
52-Week Position = (156 − 120) ÷ (180 − 120) × 100 = 36 ÷ 60 × 100 = 60%.
A reading of 60% means the stock is trading 60% of the way up its trailing 52-week range, closer to its 52-week high than its 52-week low, but not near either extreme. On its own, that 60% doesn't say whether the stock is about to keep climbing toward its high or pull back toward the middle of its range; it's a single positional data point, not a forecast.

How 52-Week Position Is Used
As a momentum screen
Momentum-oriented strategies commonly favor assets with a high 52-Week Position, trading near their 52-week high, on the theory that relative strength tends to persist over the near term, and that an asset making new highs is attracting buying interest rather than exhausting it. Screeners built around this idea typically look for a 52-Week Position screened for values near the high end of the range, combined with other confirming factors such as volume or a broader uptrend.
As a mean-reversion (contrarian) screen
Contrarian strategies use the exact same number in the opposite direction, favoring assets with a low 52-Week Position, trading near their 52-week low, on the theory that the asset has become overextended to the downside and is a candidate to revert toward the middle of its range. Screeners built around this idea typically look for a 52-Week Position screened for values near the low end of the range.
These are two established, conflicting uses of the same indicator. Neither interpretation is universally correct, an asset near its 52-week high can keep climbing or can be near a top; an asset near its 52-week low can keep falling or can be near a bottom. Which framework applies depends on the strategy, the asset, the broader market regime, and confirming evidence outside the indicator itself.
Why 52-Week Position Produces False Signals
- Range width varies enormously between assets, a stock with a narrow 52-week range can swing from 20% to 80% on a small price move, while a highly volatile asset needs a much larger move to shift the same amount. The percentage alone doesn't reveal how wide the underlying range is.
- A single spike can distort the range, a brief intraday spike or a thin-volume print can set a 52-week high or low that isn't representative of where the asset normally trades, skewing every subsequent reading until that extreme rolls out of the 52-week window.
- It ignores trend and volume, two assets can show the identical 60% reading while one is steadily climbing on rising volume and the other is drifting sideways on thin volume; the position percentage alone doesn't distinguish them.
- The window itself is a moving target, because the 52-week high and low are recalculated on a rolling basis, a reading can shift meaningfully just because an old extreme falls out of the trailing window, even if the current price hasn't moved.
Common Mistakes
- Treating a high reading as automatically bullish or a low reading as automatically bearish, the indicator supports both a momentum and a contrarian read; picking one without a stated framework isn't analysis, it's a coin flip.
- Comparing raw percentages across assets with very different range widths, a 60% reading in a tight range describes a much smaller price move than a 60% reading in a wide, volatile range.
- Ignoring how the 52-week high or low was set, a single thin-volume spike carries less weight than a level tested and held multiple times.
- Using 52-Week Position as a complete trading signal on its own, it says nothing about trend, volume, catalysts, or risk; most traders pair it with other evidence before acting.
Limitations
52-Week Position is calculated entirely from trailing, already-realized prices, the 52-week high, the 52-week low, and the current price, so it is a lagging, descriptive measure of where price sits inside its own recent range, not a predictive one. It doesn't account for the asset's fundamentals, why the high or low was set, how much volume confirmed those extremes, or broader market conditions. No single reading eliminates uncertainty or reliably forecasts direction, and the same percentage is legitimately interpreted in opposite ways by momentum and contrarian strategies.
A Position in a Range Is Not a Statement About Value
This measure places the current price within its trailing yearly range, which is a description of where price sits relative to its own recent history. It says nothing about whether that price is high or low relative to anything the business is doing, and the two readings are frequently confused.
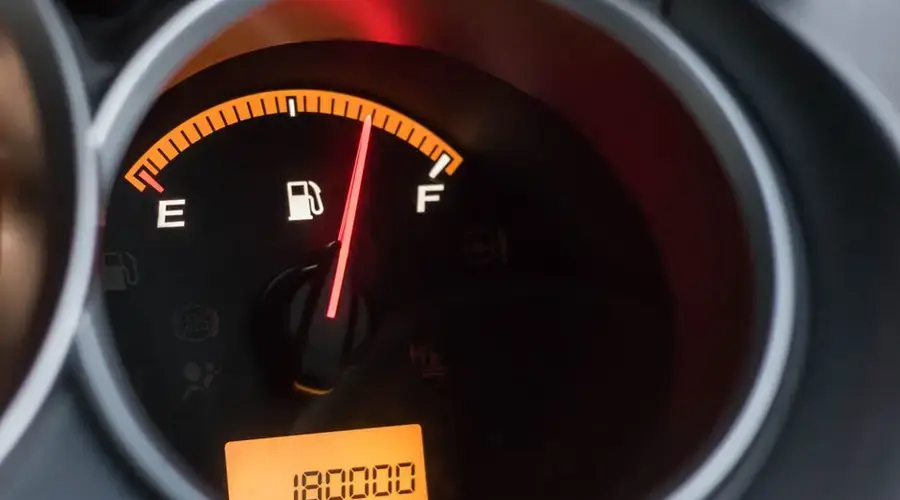
The useful application is comparative rather than absolute. Ranking a set of securities by range position separates those making new highs from those near lows, which is a starting filter for momentum or contrarian work depending on which end interests you. As a standalone signal on one security it carries little.
The mistake is treating a low reading as cheap and a high reading as extended. Securities near their lows are frequently there because conditions deteriorated, and ones near their highs are frequently there because conditions improved. Buying the first group indiscriminately means selecting for deterioration.
The window also matters more than it appears. A yearly range includes whatever happened twelve months ago, so a large move dropping out of the window changes the reading without any current price movement. The measure can shift meaningfully on a quiet day.
52-Week Position FAQs
What does 52-Week Position measure?
It shows where an asset's current price sits within its own trailing 52-week trading range, expressed as a percentage from 0% (at the 52-week low) to 100% (at the 52-week high).
How is 52-Week Position calculated?
52-Week Position (%) = (Current Price − 52-Week Low) ÷ (52-Week High − 52-Week Low) × 100. A price of $156 with a 52-week high of $180 and low of $120 gives (156 − 120) ÷ (180 − 120) × 100 = 60%.
Is a high 52-Week Position bullish or bearish?
It depends on the strategy. Momentum-oriented traders commonly favor assets near their 52-week high on the theory that relative strength tends to persist; contrarian traders favor assets near their 52-week low on the theory that the reading has overextended. Both are established, conflicting uses of the same number.
Is 52-Week Position a leading or lagging indicator?
Lagging. It is built entirely from the trailing 52-week high and low, both already-realized prices, so it describes where price has been relative to itself rather than predicting where it will go next.
Can 52-Week Position be used by itself?
It can be viewed alone, but a single percentage doesn't reveal trend direction, volume, volatility, or why the range formed. Most traders pair it with price structure or a broader screen rather than acting on the number in isolation.
Does 52-Week Position work the same for stocks and crypto?
The formula is identical, but crypto trades continuously with no exchange holidays and can be substantially more volatile, so its 52-week high and low may reflect a single sharp spike rather than a sustained level, verify how your platform sources the high/low before comparing readings across assets.
How does a stock split or dividend adjustment affect the 52-week range?
Whether the range reflects adjusted or unadjusted prices depends on the data source. An unadjusted series shows an artificial range spanning the split, producing a position reading that is meaningless. Most modern feeds adjust for splits, and treatment of dividends varies more. Confirming which convention a data source uses matters most for stocks with large distributions or recent corporate actions.
Does a reading near the top of the range mean a stock is overbought?
It means the price is near the highest level of the past year, which is a description rather than a judgment. Stocks in sustained advances spend long periods near the top of their range, and the reading stays elevated throughout. Treating a high reading as a reason to expect reversal inverts what the measure has historically been associated with in momentum research.
How does the measure behave immediately after a large gap?
A gap that establishes a new extreme resets one end of the range instantly, which can move the reading sharply in a single session. This makes the measure jumpy around news events in a way that smoothed indicators are not. It also means the range being measured can be defined largely by a single day, which is worth checking before treating the position as representative of a year of trading.