

Direct Answer
Multi-timeframe analysis is the practice of examining the same security across two or more different chart timeframes at once, such as daily and weekly, on the reasoning that a security can be in different trends at different timeframes simultaneously. A common approach uses a higher timeframe to establish the overall trend and a lower timeframe to time entries within it.
Key Takeaways
- Multi-timeframe analysis means looking at the same security on two or more chart timeframes, such as daily and weekly, at the same time, instead of relying on a single chart.
- A security can be in different trends on different timeframes simultaneously; a single-timeframe view risks missing that broader or narrower context entirely.
- A common structure uses a higher timeframe to establish the overall trend and a lower timeframe to time entries within that trend.
- Disagreement between timeframes isn't a flaw in the method, it's useful information about how conflicted the underlying trend actually is.
- Most traders limit themselves to two or three timeframes; adding more tends to produce contradictory signals rather than clearer ones.
- The approach is a framework for applying existing tools, trend lines, support/resistance, indicators, candlestick patterns, across timeframes, not a standalone signal.
What Is Multi-Timeframe Analysis?
Multi-timeframe analysis is the practice of examining the same security across two or more different chart timeframes at once, such as daily and weekly, on the reasoning that a security can be in different trends at different timeframes simultaneously. A common approach uses a higher timeframe to establish the overall trend and a lower timeframe to time entries within it.
Why One Timeframe Isn't Enough
A chart is a choice of resolution, not a complete picture. A stock can be grinding higher on the weekly chart while pulling back for several days on the daily chart, both statements are true at once, because they describe different windows of time layered on top of each other. A trader looking only at the daily chart might see the pullback and read it as a trend change, missing that the weekly structure is still intact.
This is the core reasoning behind multi-timeframe analysis: decisions made using only one timeframe risk missing that broader or narrower context. Zooming out too far can hide short-term structure that matters for entries and exits; zooming in too far can hide the larger trend that gives a trade its underlying direction. Looking at more than one timeframe at once is a way to hold both views simultaneously instead of picking one and hoping it's the complete story.
The Top-Down Approach: Trend on High, Timing on Low
The most common structure works top-down. A trader starts on a higher timeframe, weekly or daily, for example, to establish the overall trend: is the security generally rising, falling, or moving sideways over that broader window? That higher-timeframe read sets the directional bias.
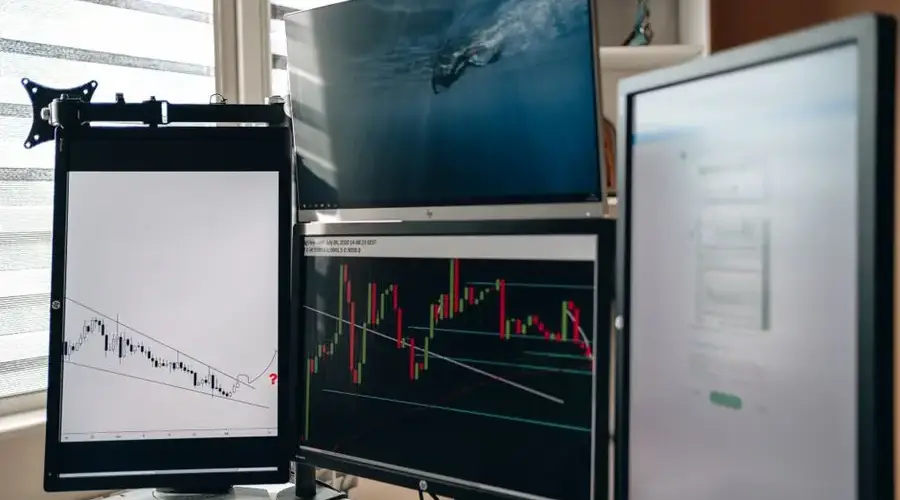
From there. The trader drops to a lower timeframe, daily or hourly, for example, to look for a specific entry point that lines up with the higher-timeframe trend. The lower timeframe isn't used to decide direction; it's used to time when to act within the direction the higher timeframe already established. A pullback on the lower timeframe inside an established higher-timeframe uptrend, for instance, is read differently than the same pullback would be read in isolation, because the surrounding context has already been set.
An illustrative scenario: a trader following a stock's weekly chart notices a well-defined uptrend over several months. Rather than buying immediately, they switch to the daily chart to wait for a shorter-term dip within that uptrend, using the daily view purely to time entry into a trend the weekly chart already identified, not to second-guess whether the uptrend exists.
When Timeframes Disagree
It's normal for timeframes to point in different directions at the same time, that's the whole reason the technique exists. A security in a long-term uptrend can still have a downtrend on a shorter timeframe, and vice versa. Multi-timeframe analysis doesn't resolve that disagreement automatically; it surfaces it, so a trader can decide deliberately how much weight to give each timeframe rather than being blind to the conflict.
How much weight the higher timeframe gets relative to the lower one is a judgment call, not a fixed rule. Some approaches treat the higher timeframe as the deciding vote and only take lower-timeframe signals that agree with it; others use the lower timeframe more independently and treat the higher timeframe as background context. Neither is objectively correct, the point of the method is making that choice explicit rather than accidental.
Limitations and Common Mistakes
- Using too many timeframes at once, stacking four or five charts tends to produce contradictory reads rather than added clarity; two or three is typically enough.
- Letting the lower timeframe override the higher one, chasing a short-term signal that contradicts the established higher-timeframe trend defeats the purpose of establishing that trend in the first place.
- Treating agreement between timeframes as a guarantee, multi-timeframe analysis describes the security's structure across windows of time; it doesn't predict what happens next in any of them.
- Ignoring that timeframes will disagree, expecting every timeframe to line up cleanly leads to hesitation or forced interpretations when they don't, which is often.
- Applying it without a consistent framework, switching which timeframe "counts" after the fact, depending on which one agrees with a preferred trade idea, undermines the discipline the method is meant to add.
A Framework, Not a Signal Generator
Multi-timeframe analysis produces no signals of its own. It is a way of organising the tools you already use, trendlines, levels, indicators, so that each one is applied at a scale you have chosen deliberately. That matters because it sets a realistic expectation: adding a second chart will not find setups the first chart missed, and its main contribution is often to disqualify a setup the single chart made look attractive.
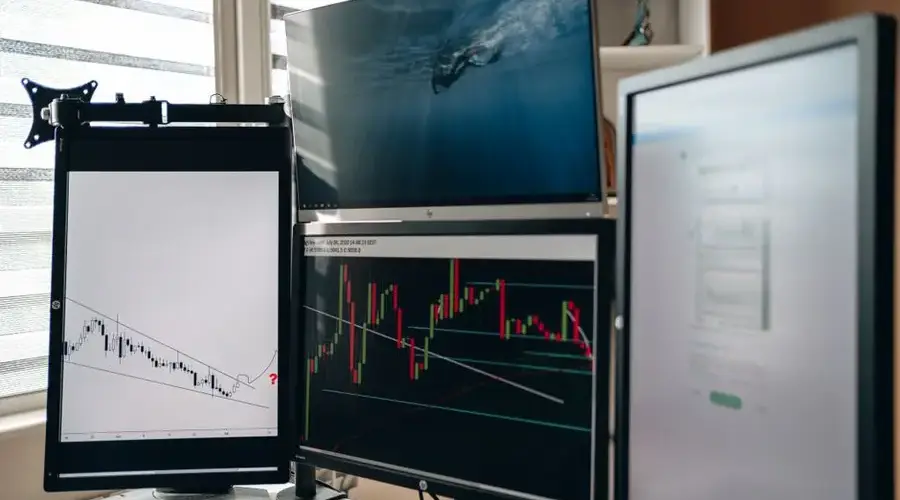
The structure most people converge on is trend from above, timing from below. What makes it work is the direction of authority. The higher chart establishes what kind of trade is available; the lower chart decides where to act on it. Chasing a lower-timeframe signal that contradicts the higher-timeframe read undoes the entire exercise while leaving the appearance of having done it.
Expect disagreement rather than treating it as a fault. Higher-timeframe bars are built out of lower-timeframe ones, so the two views describing different states is the ordinary condition. Waiting for a clean line-up across every chart you follow means either very few trades or, more commonly, quiet reinterpretation until the charts appear to agree.
Two practical limits. Two or three timeframes is generally enough, and stacking four or five reliably produces contradictions rather than resolution. And whichever structure you adopt has to stay fixed, because changing which chart counts after the outcome is known converts a framework into a justification.
Multi-Timeframe Analysis FAQs
What is multi-timeframe analysis?
Multi-timeframe analysis is the practice of examining the same security across two or more different chart timeframes, such as daily and weekly, at the same time, rather than relying on a single chart.
Which timeframe should set the trend?
A common approach uses a higher timeframe, such as weekly or daily, to establish the overall trend, then drops to a lower timeframe to time entries within that established direction.
How many timeframes should I use?
There's no fixed rule. Many traders find two or three timeframes, a higher one for context, an intermediate one for structure, and a lower one for timing, sufficient without adding so many that the analysis becomes contradictory or overwhelming.
Can multi-timeframe analysis give conflicting signals?
Yes. A security can be in an uptrend on the weekly chart while pulling back or trending down on the daily or hourly chart. That disagreement is expected and is itself useful information, not a flaw in the method.
Does multi-timeframe analysis replace other technical analysis tools?
No. It's a framework for applying existing tools, trend reading, support and resistance, indicators, candlestick patterns, across more than one timeframe rather than a separate indicator or signal on its own.
Is multi-timeframe analysis the same as using several indicators?
No, and the distinction is the reason the approach adds anything. Several indicators apply different transformations to the same series, so they share all their input and mostly duplicate each other. Several timeframes aggregate the same underlying trades differently, which genuinely changes what is being measured: a weekly bar contains information about how the week resolved that no transformation of daily data recovers.
Do the chosen timeframes need a consistent ratio between them?
Convention favours it, and the reasoning is about coverage rather than mathematics. Keeping a similar step between charts means each one describes a distinctly different horizon, whereas an uneven set can leave two charts nearly duplicating each other while a large gap sits elsewhere. Nothing breaks if the ratios differ; the set just covers the space less evenly than the analyst assumes.
Can multi-timeframe analysis introduce look-ahead bias?
Yes, and it is one of the more common ways it enters a backtest. Using a higher-timeframe value before that bar has closed means using information that was not settled at the time, because the weekly reading available on Wednesday is not the one the chart shows in hindsight. Any rule referencing a higher timeframe has to specify whether it uses the completed bar or the developing one.
Does multi-timeframe analysis apply to data other than price?
It applies to anything that aggregates. Volume, breadth measures, volatility series and even sentiment data can all be examined at more than one resolution, and the same considerations follow: the coarser series is not a smoothed version of the finer one, and the incomplete current period is provisional. The framework is about aggregation rather than about price specifically.
References
Disclaimer
This content is educational and does not constitute personalized investment advice. Multi-timeframe analysis is a framework for organizing technical observations, not a predictive system, and does not guarantee any trading outcome. Always consider your own risk tolerance and, where appropriate, consult a licensed financial professional before making investment decisions.