Technical Analysis › Candlestick Patterns: The Complete Reference
Candlestick Patterns: The Complete Reference
A candlestick pattern is a specific arrangement of one to five bars whose open, high, low, and close describe a recognisable shift in the balance between buyers and sellers. This reference covers every pattern individually, grouped by how many bars it takes to form, because bar count is what determines how long you wait for the signal and how much can change while you wait. Each page gives the exact geometry, the trend context the pattern requires to mean anything, and the look-alike it is most often confused with.

Direct Answer
A candlestick pattern is a specific arrangement of one to five bars whose open, high, low, and close describe a recognisable shift in the balance between buyers and sellers. The same shape carries opposite meaning depending on what preceded it: a hammer and a hanging man are geometrically identical, and only the prior trend separates them. A pattern read without that context is not a weak signal, it is an undefined one.
Common questions
How do you read a candlestick?
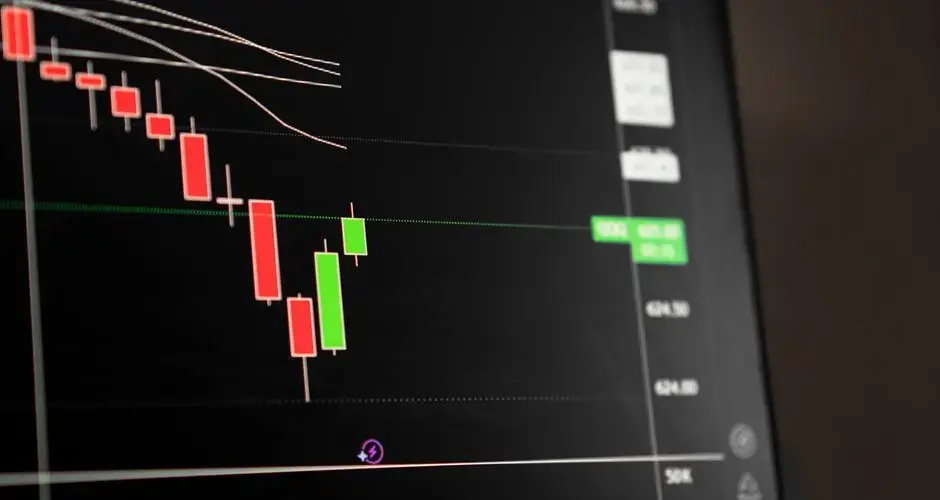
Each candle summarises one period of trading with four prices. The body spans the open and the close; the wicks reach the high and the low. A close above the open is conventionally hollow or green, a close below it filled or red. The body shows where the period settled, the wicks show what was rejected, and that distinction is what every pattern below is built from.
Why does context decide whether a pattern means anything?
The same shape carries opposite meaning depending on what preceded it. A hammer and a hanging man are geometrically identical; the hammer appears after a decline and the hanging man after an advance. A pattern read without its prior trend is not a weak signal. It is an undefined one.
Every guide in this section
88 guides in this section.
Reading candlesticks
Start here: anatomy, the context that validates a pattern, and how patterns fail.
- Candlestick Anatomy: How to Read a Candle
A candlestick plots open, high, low, and close for one period.
- Candlestick Patterns: Context & Confirmation
A candlestick pattern alone is a weak signal.
- When Candlestick Patterns Fail & Look-Alikes
Candlestick patterns fail when price stalls, forms in choppy markets, or gets confused with a similar pattern.
- Candlestick Patterns: Stocks vs. Crypto
Stocks trade in sessions with opening and closing auctions and can gap overnight; crypto trades 24/7 with no session boundaries and different gap behavior.
Single-bar patterns
One bar carries the whole signal, so it resolves immediately, and gives you the least confirmation.
- Bearish Belt Hold Candlestick Pattern: Signals
A Bearish Belt Hold opens at the session's high with little to no upper wick, then closes near the low, signaling sellers took control after an uptrend.
- Belt Hold Candlestick Pattern: Signals
A belt hold is a single-candle pattern with no wick at the opening end, closing strongly near the high or low.
- Bullish Belt Hold Candlestick Pattern: Signals
A Bullish Belt Hold opens at the session's low with no lower wick and closes strongly near the high, signaling buyers seized control after a downtrend.
- Doji Candlestick Pattern: Signals
A doji forms when a candle's open and close are nearly equal.
- Dragonfly Doji Candlestick Pattern: Signals
A dragonfly doji forms when open, high, and close cluster near the top of the bar with a long lower wick.
- Four-Price Doji Candlestick Pattern: Signals
A four-price doji forms when open, high, low, and close are all exactly equal, a flat bar with zero range.
- Gravestone Doji Candlestick Pattern: Signals
A Gravestone Doji forms when the open, low, and close cluster near the bottom of the bar with a long upper wick, signaling a bearish rejection of higher prices.
- Hammer Candlestick Pattern: Signals
A hammer candlestick has a small body near the top of the range and a long lower wick, forming after a downtrend.
- Hanging Man Candlestick Pattern
The hanging man has a small body near the top with a long lower wick after an uptrend.
- High Wave Candle Candlestick Pattern: Signals
A high wave candle is a single-bar pattern with a small body and unusually long wicks on both sides, showing price swung widely before closing near its open.
- Inverted Hammer Candlestick Pattern
Inverted hammer candlestick: a small body near the bar's low with a long upper wick after a downtrend.
- Long Bearish Candle Pattern: Signals
A Long Bearish Candle is a single bar with a long red body and small wicks, showing sellers controlled the session.
- Long Bullish Candle Pattern: Signals
A Long Bullish Candle is a single bar with a long green body and small wicks, showing buyers controlled the session.
- Long-Legged Doji Candlestick Pattern: Signals
A long-legged doji has unusually long wicks on both sides with a near-equal open and close near the middle, an extreme signal of two-sided indecision.
- Marubozu Candlestick Pattern: Signals
A marubozu is a full-bodied candle with no wicks, meaning one side controlled the entire session.
- Shooting Star Candlestick Pattern
A shooting star forms after an uptrend: small body near the low, long upper wick, signaling a bearish reversal.
- Short Bearish Candle Candlestick Pattern: Signals
A Short Bearish Candle is a single bar with a small red body showing modest selling pressure.
- Short Bullish Candle Pattern: Signals
A Short Bullish Candle is a small green body showing modest buying pressure.
- Spinning Top Candlestick Pattern: Signals
A Spinning Top candle has a small real body with upper and lower wicks of similar length, showing two-sided price action but no decisive winner by the close.
- Takuri Line Candlestick Pattern: Signals
A Takuri Line forms after a downtrend when the body sits near-zero at the top of the range, with a long lower wick testing price lower before buyers reject it.
Two-bar patterns
The second bar defines the pattern against the first, usually by engulfing, piercing, or gapping away from it.
- Bearish Counterattack Candlestick Pattern: Signals
A Bearish Counterattack is a two-bar reversal where a gap-up open sells off, closing at the prior bar close.
- Bearish Doji Star Candlestick Pattern: Signals
A bearish doji star is a two-bar pattern: a long bullish candle followed by a doji gapping above its high, warning of a possible reversal without confirmation.
- Bearish Engulfing Candlestick Pattern
A bearish engulfing pattern forms when a large red candle's body fully swallows the prior small green candle after an uptrend.
- Bearish Harami Candlestick Pattern: Signals
A bearish harami forms when a small candle sits fully inside the prior long bullish candle's body after an uptrend.
- Bearish Kicker Candlestick Pattern: Signals
A bearish kicker is a two-bar reversal pattern: a gap-down candle with zero body overlap follows a bullish bar in an uptrend, signaling a sharp reversal.
- Bearish Separating Lines Candlestick
A bearish separating lines pattern is a two-bar continuation signal in a downtrend: a bullish bounce bar followed by a bearish bar sharing the same open.
- Bullish Counterattack Candlestick Pattern: Signals
A bullish counterattack is a two-bar reversal where a bearish candle is followed by a bar that gaps down then rallies to close near the first bar's close.
- Bullish Doji Star Candlestick Pattern: Signals
A bullish doji star is a two-bar reversal pattern where a doji gaps below a long bearish candle's low after a downtrend.
- Bullish Engulfing Candlestick Pattern
A bullish engulfing pattern forms when a larger green candle's body fully engulfs the prior red candle's body after a downtrend.
- Bullish Harami Candlestick Pattern: Signals
A bullish harami forms when a small candle is fully contained within the prior long bearish candle's body, signaling stalling momentum after a downtrend.
- Bullish Kicker Candlestick Pattern: Signals
A Bullish Kicker is a two-bar reversal pattern where a bullish candle gaps completely above the prior bearish candle's range, with zero body overlap.
- Bullish Separating Lines Candlestick
A Bullish Separating Lines pattern forms when a bearish dip candle opens at the same price as the bullish candle that follows, continuing the uptrend.
- Dark Cloud Cover Candlestick Pattern: Signals
A dark cloud cover forms when a bullish candle is followed by a bar that gaps up then closes over halfway into its body.
- Descending Hawk Candlestick Pattern: Signals
A descending hawk is a two-bar bearish reversal warning: two same-color bullish candles where the second body shrinks inside the first, showing fading momentum.
- Falling Window Candlestick Pattern: Signals
A falling window is a bearish candlestick gap where a bar's entire range sits below the prior bar's range, signaling accelerating selling pressure.
- Gap Side-by-Side White Lines Candlestick
A gap side-by-side white lines pattern forms when two similar bullish candles open near the same price after a gap up, with the gap staying open.
- Harami Cross Candlestick Pattern: Signals
A Harami Cross forms when a doji is contained within the prior candle's large real body.
- Homing Pigeon Candlestick Pattern: Signals
A homing pigeon is a two-bar bullish reversal like a Bullish Harami, but both candles stay the same bearish color.
- In-Neck Pattern Candlestick Pattern: Signals
An in-neck pattern is a bearish continuation pattern where the second candle closes barely above the first bar's close.
- Matching Low Candlestick Pattern: Signals
A matching low is a two-bar bullish reversal pattern where both candles are bearish but close at nearly the same price, signaling failed selling pressure.
- Meeting Lines Candlestick Pattern: Signals
A Meeting Lines pattern forms when two opposite-colored candles close at the same price across a gap, signaling a potential bullish reversal after a downtrend.
- On-Neck Pattern Candlestick Pattern: Signals
The on-neck pattern is a two-bar bearish continuation candlestick where the second bar closes at the first bar's low.
- Piercing Pattern Candlestick: Signals
A piercing pattern is a two-bar bullish reversal: price gaps down, then closes over half into the prior candle's body.
- Rising Window Candlestick Pattern: Signals
A rising window is a bullish gap pattern: a bar's entire range sits above the prior bar's, leaving an unfilled gap that signals accelerating buying pressure.
- Thrusting Pattern Candlestick Pattern: Signals
A thrusting pattern is a two-bar bearish continuation candle where the second bar closes below the first bar's body midpoint, unlike a piercing pattern.
- Tweezer Bottom Candlestick Pattern: Signals
A Tweezer Bottom forms when two candles share nearly the same low after a downtrend, with the second reversing higher.
- Tweezer Top Candlestick Pattern: Signals
A Tweezer Top forms when two consecutive candles share nearly the same high after an uptrend, marking a rejected price level and a possible bearish reversal.
Three-bar patterns
A three-bar sequence describes a turn in progress: thrust, pause, reversal.
- Advance Block Candlestick Pattern: Signals
An advance block forms when three rising candles in an uptrend show shrinking bodies and longer upper wicks, warning bullish momentum is fading.
- Bearish Abandoned Baby Candlestick
A bearish abandoned baby is a rare three-bar reversal after an uptrend: a bullish candle, an isolated doji gapped above it, then a bearish candle gapping below.
- Bullish Abandoned Baby Pattern: Signals
A bullish abandoned baby is a rare, three-bar bullish reversal: a bearish candle, a doji gapped below into an island, then a bullish candle gapping up above it.
- Deliberation Pattern Candlestick Pattern: Signals
A deliberation pattern is a bearish three-bar warning where two strong up-candles are followed by a small body near the top, signaling stalled momentum.
- Downside Gap Three Methods Pattern: Signals
A downside gap three methods pattern is a bearish continuation signal: two long candles gap down, then a rally fills the gap before the downtrend resumes.
- Downside Tasuki Gap Candlestick Pattern: Signals
A downside tasuki gap is a bearish continuation pattern: a third bullish bar partially fills a prior gap down, leaving part of it open as resistance.
- Evening Doji Star Candlestick Pattern: Signals
The Evening Doji Star is a bearish three-bar reversal pattern with a doji middle candle, signaling stronger indecision than a standard Evening Star.
- Evening Star Candlestick Pattern
Evening star candlestick pattern: a three-candle bearish reversal after an uptrend -- long green body, gapped-up star, long red close into the range.
- Morning Doji Star Candlestick Pattern: Signals
A Morning Doji Star is a bullish three-bar reversal where the middle candle is a doji.
- Morning Star Candlestick Pattern
The morning star candlestick pattern is a three-candle bullish reversal signal: a long bearish body, a small indecisive star, then a strong bullish close.
- Stalled Pattern Candlestick Pattern: Signals
The stalled pattern is a bearish 3-bar reversal: two strong up-candles followed by a small third body near the top of the range, signaling stalling momentum.
- Stick Sandwich Candlestick Pattern: Signals
A stick sandwich is a three-bar bullish reversal where the first and third bars close at nearly the same level, sandwiching an opposite-colored middle bar.
- Three Black Crows Candlestick Pattern: Signals
Three Black Crows is a bearish three-candle reversal pattern with lower closes and minimal wicks.
- Three Inside Down Candlestick Pattern: Signals
A Three Inside Down is a bearish reversal: a Bearish Harami followed by a third candle closing below the first candle's low, confirming the move.
- Three Inside Up Candlestick Pattern: Signals
A three inside up pattern is a bullish reversal: a Bullish Harami followed by a third bar closing above the first candle's high, confirming the signal.
- Three Outside Down Candlestick Pattern: Signals
A Three Outside Down is a bearish reversal pattern combining a Bearish Engulfing with a third confirming candle that closes lower, signaling trend reversal.
- Three Outside Up Candlestick Pattern: Signals
A Three Outside Up is a bullish reversal pattern: Bullish Engulfing plus a third bar confirming higher, signaling a possible trend change after a downtrend.
- Three Stars in the South Pattern: Signals
Three Stars in the South is a rare bullish reversal where each bearish candle shrinks in range and lower wick, signaling fading selling.
- Three White Soldiers Candlestick Pattern
Three white soldiers is a three-candle bullish reversal pattern with long bodies and small wicks after a downtrend.
- Tri-Star (Bearish) Candlestick Pattern: Signals
A Tri-Star is a rare bearish reversal pattern where three consecutive dojis form after an uptrend, with the middle doji gapping above the other two.
- Tri-Star (Bullish) Candlestick Pattern: Signals
A tri-star is a rare three-bar bullish reversal where all three candles are dojis, with the middle one gapping below the others after a downtrend.
- Two Crows Candlestick Pattern: Signals
A Two Crows forms when two bearish candles follow a gap up in an uptrend; the third bar closes deep into the first candle's body, but the gap stays unfilled.
- Unique Three River Candlestick Pattern: Signals
A unique three river is a rare three-bar bullish reversal pattern after a downtrend, with a long bearish bar, a contained-low bar, and a small bullish close.
- Upside Gap Three Methods Candlestick
Upside Gap Three Methods is a bullish continuation pattern: two gapped-up candles followed by a pullback bar that fills the gap before the uptrend resumes.
- Upside Gap Two Crows Candlestick Pattern: Signals
An upside gap two crows is a bearish reversal pattern: after an uptrend, two bearish candles gap up and the second engulfs the first without filling the gap.
- Upside Tasuki Gap Candlestick Pattern: Signals
An upside tasuki gap is a three-bar bullish continuation pattern where a pullback candle partially fills a gap between two rising bullish candles.
Four- and five-bar patterns
The longest formations, mostly continuation patterns that need a full pause to complete.
- Bearish Breakaway Candlestick Pattern: Signals
A bearish breakaway is a five-bar reversal after an uptrend: a gap up, small drifting bars, then a long bearish close back into the gap.
- Bullish Breakaway Candlestick Pattern: Signals
A bullish breakaway is a five-bar reversal where a downtrend drifts lower before a sharp bullish candle closes back into the gap.
- Concealing Baby Swallow Candlestick
A concealing baby swallow is a rare four-bar bearish continuation pattern where a failed upward wick reversal gets fully engulfed by a new low close.
- Falling Three Methods Candlestick Pattern: Signals
A falling three methods pattern is a five-bar bearish continuation signal that resumes a downtrend after a brief pause.
- Ladder Bottom Candlestick Pattern: Signals
A ladder bottom is a five-bar bullish reversal candlestick pattern seen after a downtrend: three declining bars, a warning bar, then a gap-up reversal candle.
- Mat Hold Candlestick Pattern: Signals
A mat hold is a five-bar bullish continuation pattern in an uptrend: a strong bar, a gap-up pullback, and a new-high close confirm the move.
- Rising Three Methods Candlestick Pattern: Signals
Rising Three Methods is a five-bar bullish continuation pattern: a long bullish candle, three small pause candles, then a bullish breakout to a new high.
- Three Gaps Down Candlestick Pattern: Signals
Three gaps down is a bearish pattern where three falling windows occur in a row during a downtrend.
- Three Gaps Up Candlestick Pattern: Signals
Three Gaps Up is an exhaustion pattern with three consecutive rising windows in an uptrend.
- Three-Line Strike (Bearish): Candlestick Signals
A three-line strike (bearish) is a four-bar pattern: three declining candles followed by a bullish bar that engulfs them all, classically read as continuation.
- Three-Line Strike Bullish Candlestick
A bullish three-line strike is a four-bar pattern: three rising candles, then a bearish bar engulfing them all.
Each candle covers one period. The body spans the open and the close, and its colour says which came first. The thin wicks reach the highest and lowest prices traded. A long wick means price went somewhere and did not stay.
Every pattern on this page is built from these four prices. Read the body and wicks before reading the pattern name.