
Direct Answer
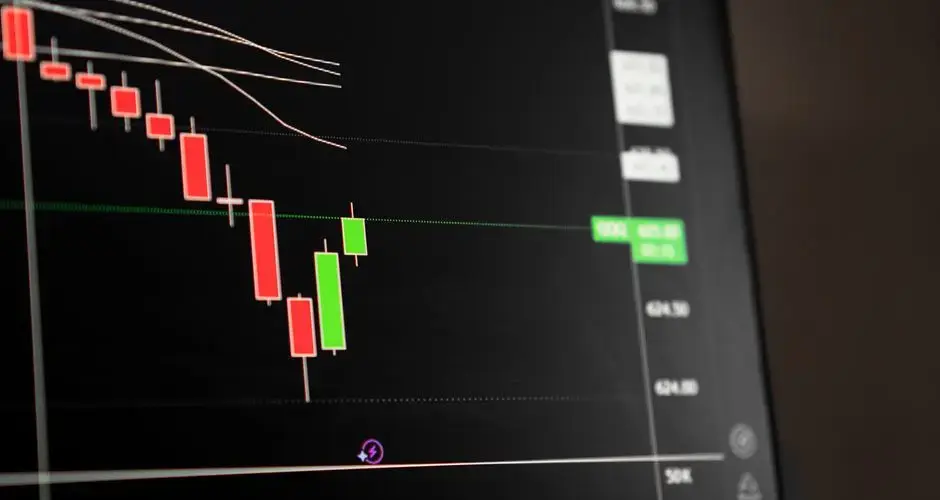
The downside tasuki gap is a three-candle pattern that forms within an established downtrend. Its defining feature is a gap down between the first two bars, followed by a third bar that attempts to fill that gap but stops short of doing so completely.
Key Takeaways
- A downside tasuki gap is a three-bar bearish continuation pattern that appears within an existing downtrend.
- The first two bars are both long bearish candles with a gap down between them.
- The third bar is bullish, opens within the second bar's body, and rallies partway into the gap, but does not fully close it.
- Because the gap stays partly open, the unfilled portion is read as a level that can act as resistance if the downtrend resumes.
- The pattern is easy to confuse with Downside Gap Three Methods, which looks identical except the third bar fully closes the gap.
Downside Tasuki Gap Candlestick Pattern: Formation, Meaning, and Signals
A downside tasuki gap is a three-bar bearish continuation pattern: two long bearish candles separated by a gap down, followed by a bullish third bar that rallies partway into the gap without fully closing it. The unfilled portion of the gap is treated as a level that can act as resistance if the downtrend resumes.
What Is a Downside Tasuki Gap?
The downside tasuki gap is a three-candle pattern that forms within an established downtrend. Its defining feature is a gap down between the first two bars, followed by a third bar that attempts to fill that gap but stops short of doing so completely. The pattern is a continuation signal, not a reversal signal, it appears mid-trend and, when read as intended, suggests the prevailing downtrend is likely to resume rather than reverse.
Because the pattern depends on the relationship between three specific bars, two bearish with a gap between them, then one bullish rally that partially retraces, it can't be identified from a single candle. All three bars, and the gap between the first two, have to be read together.
How a Downside Tasuki Gap Forms
The first bar is a long bearish candle, consistent with the downtrend already in progress. The second bar is also a long bearish candle, and it gaps down from the first, its high sits below the first bar's low, leaving a visible gap on the chart. The third bar is bullish: it opens within the second bar's body and rallies back up, moving partway into the gap left by the first two bars.
What separates a downside tasuki gap from a full gap-fill is that the third bar's rally does not fully close the gap, part of the gap between the first and second bars remains open even after the third bar's close. That partial fill is the pattern's core distinguishing detail.
Downside Tasuki Gap Example
The chart below shows a deterministic, illustrative example: a downtrend leading in, the three-bar downside tasuki gap forming, then two possible continuations, a confirmation (the downtrend resumes and the unfilled gap holds as resistance) and a failure/look-alike (price pushes through and fully closes the gap instead). Toggle between them to see why the partial fill alone doesn't guarantee continuation.
How to Trade a Downside Tasuki Gap
Read the size of the unfilled gap
Because the third bar only partially fills the gap, some traders read this as a slightly stronger continuation signal than Downside Gap Three Methods, where the third bar fully closes the gap. The portion of the gap that stays open is treated as the level to watch, if the downtrend resumes, that unfilled area is expected to act as resistance.
Watch for the downtrend to resume
The pattern itself is complete after the third bar closes, but its continuation reading depends on what happens next. Price turning back down and respecting the unfilled portion of the gap as resistance is what traders look for to treat the pattern as working as expected.
Track whether the gap gets fully closed
If subsequent price action pushes back up and fully closes the remaining open gap, the continuation read no longer holds, at that point the setup more closely resembles a Downside Gap Three Methods pattern instead.
Common Downside Tasuki Gap Mistakes
- Confusing a fully-filled gap with a partially-filled one, a downside tasuki gap and a Downside Gap Three Methods pattern are distinguished specifically by how much of the gap the third bar closes.
- Treating the pattern as a reversal signal, it's a continuation pattern that appears mid-downtrend, not a bottoming signal.
- Ignoring the surrounding trend, the same three-bar shape outside an established downtrend doesn't carry the same continuation reading.
- Assuming the third bar's bullish close means the trend has turned, the third bar's rally is part of the pattern's definition, not evidence against the downtrend.
Downside Tasuki Gap vs. Similar Patterns
| Pattern | Bars | Key difference |
|---|---|---|
| Downside Tasuki Gap | 3 | Baseline, third bar partially fills the gap, leaving part of it open |
| Downside Gap Three Methods | 3 | Third bar fully fills and closes the gap instead of leaving it partly open |
| Falling Window | 2 | Just the gap-down concept between two bars, without any third-bar fill attempt |
Limitations of the Downside Tasuki Gap Pattern
A downside tasuki gap describes a specific three-bar relationship between two gapped-down bearish candles and a partial-fill bullish bar, it does not carry information about volume, order flow, or why the gap formed in the first place. It also doesn't guarantee the downtrend resumes: the unfilled portion of the gap is a level to watch, not a certainty. Like any multi-bar pattern, it works best combined with trend context and a plan for what invalidates the reading, not used in isolation.
A Bullish Bar Inside a Bearish Pattern
The third candle here is green, and it belongs. A bullish bar rallying partway into the gap is exactly what the pattern describes: a bounce that ran out of room before erasing the gap, which the pattern reads as the decline remaining intact. Treating that green candle as evidence against the bearish reading misunderstands the structure, since the pattern was built to include it.
What matters is where the bounce stops. Partway into the gap keeps the pattern; fully closing it produces a different pattern entirely, so the unfilled remainder is the discriminator rather than the colour of the bar.
Because the boundary is a known price, this is one of the more checkable patterns in the family. Mark the gap edges when the second bar prints and the third bar answers the question for you.
The usual conditions apply: two genuine gaps-adjacent bars mean the pattern is scarce where markets trade continuously, and the continuation reading requires an established downtrend rather than a couple of down sessions.
Downside Tasuki Gap FAQs
Is a downside tasuki gap always a continuation signal?
It's read as one when it appears in an established downtrend, since all three bars form around an existing bearish move. The same three-bar shape appearing outside a downtrend doesn't carry the same continuation reading.
What's the difference between a downside tasuki gap and a downside gap three methods pattern?
Both start with two long bearish bars separated by a gap down, followed by a bullish third bar. The difference is how much of the gap that third bar closes: in a downside tasuki gap it only partially fills the gap, while in downside gap three methods it fully closes it.
Why does the third bar matter if it's bullish?
The third bar's rally into the gap tests how much of the prior gap down the market is willing to reclaim. Because it stops short of fully closing the gap, the unfilled portion is read as a level where selling pressure reasserted itself.
Does the downside tasuki gap need confirmation?
The pattern is defined by three completed bars, so it's already fully formed by the close of the third bar. Traders typically still want to see the downtrend resume on subsequent bars before treating the continuation reading as confirmed.
What invalidates a downside tasuki gap?
If price continues higher and fully closes the remaining open portion of the gap, the pattern no longer holds as a downside tasuki gap, at that point it more closely resembles a downside gap three methods pattern instead.
Where does the tasuki name come from?
Tasuki is the Japanese word for the cord used to tie back kimono sleeves, which crosses over itself at the back. The name describes the crossing appearance of the third candle cutting back across the second, not any market interpretation. As with much candlestick naming, the term is visual and the reading attached to it came later.
How much of the gap may the third candle fill?
Part of it, and not all of it. The third candle opens inside the second body and rises into the gap without closing it, which is the condition separating this pattern from a genuine recovery. Implementations differ on how far into the gap is acceptable, and the strictest version requires the close to remain below the first candle low.
Does the downside tasuki gap have an upside counterpart?
Yes, the upside tasuki gap, which is the same construction inverted: two up candles separated by a gap, followed by a down candle that opens inside the second body and falls into the gap without filling it. Both are continuation patterns. They are documented as a pair, and the shared name is why the direction has to be stated when either is referenced.
Can a tasuki gap form where there are no overnight gaps?
Rarely, since the gap between the first two candles is the structural element the whole pattern is built around. Continuously traded instruments produce gaps only across weekend closures or liquidity failures, so the pattern is largely confined to markets with a session break. A version identified on such a chart usually rests on a relaxed gap definition.
References
- CMT Association: Technical Analysis Body of Knowledge and Research
- CFA Institute Research and Policy Center: Investment Research
- Steve Nison, Japanese Candlestick Charting Techniques (1991), the book credited with popularizing Japanese candlestick analysis in Western markets.
- SEC Investor.gov: Introduction to Investing