
Direct Answer
Candlestick patterns are defined identically in stocks and crypto, because the geometry is built from the same open, high, low, and close: a hammer is a hammer either way. What differs is market structure. Stocks trade in defined sessions with opening and closing auctions and can gap between sessions, while crypto trades continuously with no session close, so gap-based patterns such as rising and falling windows are far less common in crypto, and a daily crypto candle is a calendar convention rather than a real exchange session.
Candlestick Patterns: Stocks vs. Crypto Markets
Candlestick geometry and pattern definitions are identical for stocks and crypto, a hammer is a hammer either way. What differs is market structure: stocks trade in defined sessions with opening and closing auctions and can gap between sessions, while crypto trades 24/7 with no session boundaries, which changes how often gap-based patterns occur and how a "daily candle" is even defined.
Key Takeaways
- Pattern definitions, body, wick, engulfing, harami, and the rest, are market-agnostic; the same geometry means the same thing on a stock chart or a crypto chart.
- Stock exchanges run defined sessions with an opening and closing auction, so news or order imbalances that build up while the exchange is closed can show up as a price gap at the next open.
- Crypto markets trade continuously with no session close, so there's no fixed reopening moment for a gap to form into, abrupt moves happen, but they unfold within continuous trading rather than jumping between a close and a reopen.
- A daily stock candle aggregates one real, exchange-defined session. A daily crypto candle is a calendar convention (typically midnight-to-midnight in some timezone) layered onto a market that never closes.
- Gap-specific patterns (rising window, falling window, three gaps up, three gaps down, tasuki gap patterns) are far less common in crypto than in stocks because they depend on a real price gap between consecutive bars.
- Liquidity and volatility vary by asset in both markets, but thinner order books, common in smaller crypto assets, can produce more erratic candle shapes that resemble a pattern without the participation behind it.
Session-Based Trading vs. Continuous Trading
Major U.S. stock exchanges operate defined regular trading hours with a formal opening auction that sets the day's first trade and a formal closing auction that sets the day's last trade, followed by a period where the exchange is shut. Anything that happens between the close and the next open, earnings releases, macro news, after-hours order flow, has nowhere to trade on that exchange until it reopens, so it can show up as a jump between the previous close and the next open: a gap.
Crypto exchanges, by contrast, generally operate continuously, no scheduled open, no scheduled close, no overnight shutdown. New information can move price at any hour, but it does so within ongoing trading rather than accumulating until a fixed reopening moment. That's the core structural reason gap-based candlestick patterns behave differently across the two markets: stocks have a specific mechanism (the overnight/weekend session boundary) that regularly produces gaps; crypto largely doesn't have that mechanism.
Gap-Based Patterns and Why They Differ
Several patterns in this site's library are explicitly built around a gap between bars, the pattern's definition doesn't work without one:
| Pattern | Bar count | What the gap does |
|---|---|---|
| Rising window | 2 | Second bar's entire range opens above the first bar's high |
| Falling window | 2 | Second bar's entire range opens below the first bar's low |
| Three gaps up | 4 | Three separate up-gaps stacked in sequence |
| Three gaps down | 4 | Three separate down-gaps stacked in sequence |
| Upside tasuki gap | 3 | A gap-up bar followed by a bar that partially, but not fully, fills the gap |
| Downside tasuki gap | 3 | A gap-down bar followed by a bar that partially, but not fully, fills the gap |
In stocks, these patterns most commonly form around overnight or weekend session boundaries, a bar's open beginning above or below the previous bar's range because of what happened while the exchange was closed. In a 24/7 market without that boundary, the exact price discontinuity these patterns require is a much rarer occurrence; abrupt crypto moves are more likely to show up as an unusually long-bodied or long-wicked candle within continuous trading than as a clean gap between two bars. That doesn't make the underlying idea (a sudden, one-directional shift in control) irrelevant to crypto, it makes the specific gap-based geometry less applicable, and other single- or two-bar patterns (like marubozu or engulfing) more directly comparable across both markets.
What a "Daily Candle" Actually Means in Each Market
A daily stock candle has a real anchor: it aggregates one exchange session, bounded by an actual opening auction and an actual closing auction. The open, high, low, and close are all tied to real, exchange-defined moments in that session.
A daily crypto candle has no equivalent anchor. Because the underlying market never closes, "daily" is a calendar convention a charting platform or exchange applies on top of continuous trading, typically midnight-to-midnight in UTC or another chosen timezone. The open is simply the first trade after that clock boundary and the close is the last trade before the next one, not the outcome of a formal opening or closing auction. The candle geometry (body, wicks, direction) still means the same thing once drawn, but the boundary that defines where one candle ends and the next begins is a convention rather than a market structure fact.
Rising Window Example
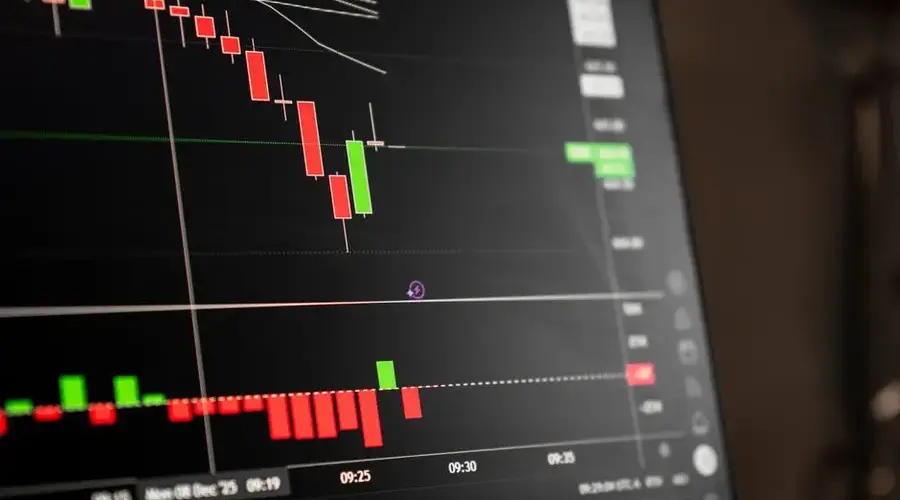
The chart below shows a rising window: the second bar's entire range opens above the first bar's high, leaving a visible gap between them. This is the kind of gap that forms readily around a stock's session boundary and much less readily in a market that never closes.
Liquidity, Volatility, and Pattern Reliability
Liquidity and typical volatility vary widely by individual asset in both stocks and crypto, a large, actively traded stock and a large, actively traded crypto asset can both have deep order books and orderly price action. But it's common for smaller-capitalization crypto assets to trade with thinner order books than comparably sized stocks, since crypto markets are newer, more fragmented across exchanges, and less subject to the market-maker obligations that exist on many regulated stock exchanges. Thinner liquidity means individual trades can move price further, which can produce candle shapes that resemble a pattern (a long wick, a small body, an apparent engulfing move) without the same breadth of participation behind it that the pattern's traditional interpretation assumes.
None of this means candlestick patterns are unusable in crypto, the underlying idea of reading a bar's shape as a description of who controlled it applies in any market with public price data. It means the same shape deserves somewhat more skepticism, and more reliance on confirmation and location (see why candlestick patterns need context and confirmation), in a lower-liquidity venue than in a deep, heavily participated one.
In Crypto, Where the Day Starts Is a Convention
A daily stock candle has an unarguable definition: it runs from the opening bell to the closing bell, and both boundaries are events with auctions attached. A daily crypto candle has no such anchor. Trading never stops, so the boundary is whatever the data provider chose, usually a clock time in a chosen zone, and shifting it by a few hours produces different opens, different closes and therefore different patterns from identical trading.
That is worth pausing on, because it means a doji or an engulfing candle on a crypto daily chart is partly an artefact of the provider convention. Two charts of the same asset can disagree about whether a pattern exists, and neither is wrong.
Gaps are the other structural difference. Stock sessions close, so information arriving overnight shows up as a gap at the next open, and a family of patterns depends on that. Continuous markets have no reopening moment for a gap to form into, so those patterns occur rarely or not at all, and a pattern definition that requires one simply does not apply.
The geometry itself transfers unchanged. A hammer is a hammer in either market, and what differs is how often the conditions that produce each pattern arise and how much liquidity stands behind the bars that form it.
Stocks vs. Crypto Candlestick FAQs
Do candlestick patterns work the same way on stocks and crypto?
The pattern definitions and body/wick geometry are identical on both. What differs is the market structure behind the candles: stocks trade in defined sessions with opening and closing auctions, while crypto trades continuously, which changes how often certain patterns, especially gap-based ones, actually occur.
Why do stocks gap between sessions but crypto rarely does?
A stock's exchange session has a defined close and a defined next open, and news or order imbalances that accumulate while the exchange is shut show up as a price gap when it reopens. Crypto markets trade around the clock with no session close, so there's no fixed reopening moment for overnight information to gap into, price can still move sharply, but it does so continuously rather than jumping between a close and a reopen.
Is a daily crypto candle the same kind of thing as a daily stock candle?
Not exactly. A daily stock candle aggregates one exchange session, which has an official open and close. A daily crypto candle is a calendar convention, typically midnight-to-midnight in whatever timezone the exchange or charting platform uses, layered onto a market that never actually closes, rather than a period bounded by real session boundaries.
Are gap-based candlestick patterns still relevant for crypto?
They're rarer and different in character. Continuation and reversal patterns built on wicks and bodies within a session (like a hammer or engulfing pattern) behave similarly in both markets. Patterns built specifically around session-boundary gaps (like a rising window or three gaps up) depend on a real price gap between bars, which is a much less common occurrence in a 24/7 market than in a stock that closes and reopens daily.
Does lower liquidity affect candlestick pattern reliability in crypto?
Liquidity and typical volatility vary by asset and venue in both markets, but many smaller crypto assets trade with thinner order books than large-cap stocks. Thinner liquidity means individual trades can move price more, which can produce more erratic-looking candle shapes that resemble a pattern without the same underlying participation behind it.
How does the absence of a closing auction change crypto candles?
Substantially, because in equity markets the daily close is an auction price that concentrates a large share of the day orders into one crossing. Cryptocurrency has no such mechanism, so the daily close is whatever price prevailed at an arbitrary cutoff. Every pattern that depends on the closing price, which is most of them, is therefore built on a differently constructed number.
Does the choice of daily boundary change which patterns appear?
Directly. A continuously traded asset has no natural day boundary, so the open, high, low and close all depend on where the vendor cuts the day. Shifting that boundary by a few hours produces different bodies and different shadows, which means a doji or an engulfing bar on one provider chart may simply not exist on another.
Do venue differences affect candlestick patterns in crypto?
They can. There is no consolidated tape, so each exchange produces its own price series with its own extremes, and a pattern visible on one venue chart may be absent on another. That is a different situation from equities, where consolidated data smooths over venue differences. A pattern claim in cryptocurrency implicitly names a venue.
Does the round-the-clock schedule change how patterns are interpreted?
It removes the overnight information-accumulation mechanism that several patterns implicitly rely on. Gap patterns describe what happens when news arrives while the market is closed and is priced at the open. In a market that never closes, that repricing happens continuously in visible trading. The gap-based patterns therefore do not simply become rarer, the process they describe does not occur.