
Direct Answer
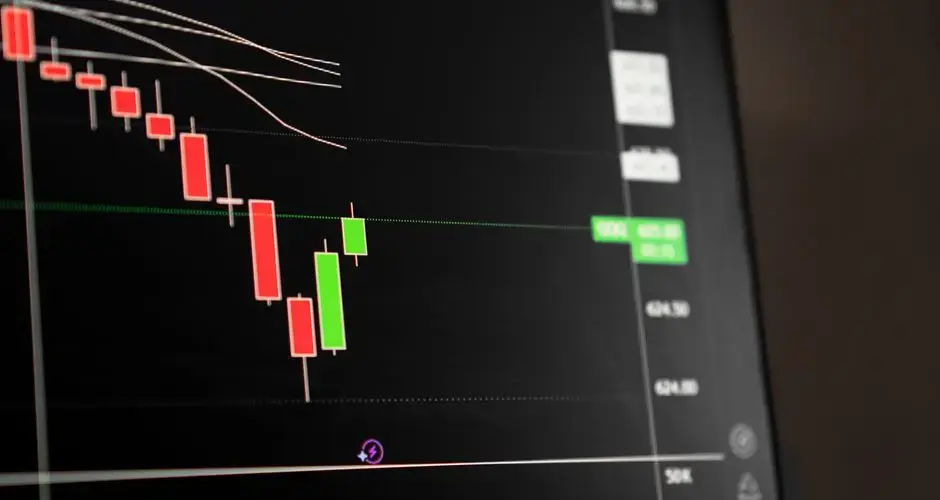
A hammer plots the same four prices as any candlestick, open, high, low, close, but arranges them in a distinctive way: the open and close sit close together near the top of the bar's range, forming a small body, while the low extends well below the body, creating a long lower wick. The upper wick, if present at all, is short.
Key Takeaways
- The identical shape after an uptrend is called a hanging man and carries the opposite (bearish) signal, the preceding trend, not the shape, determines which name and meaning apply.
- A lower wick shorter than roughly twice the body's size is a weaker signal, closer to an ordinary small-bodied candle than a true hammer.
- Most approaches wait for the next bar to close above the hammer's high before treating the setup as an actionable bullish signal, since the hammer alone only shows a rejection of lower prices.
- The hammer's own low is the natural invalidation level: a close below it instead of confirming above the high negates the bullish read.
Hammer Candlestick Pattern: Formation, Meaning, and Signals
A hammer is a single-bar candlestick with a small body near the top of its range, a lower wick at least twice the body's size, and little or no upper wick. It appears after a downtrend and is a candidate bullish reversal signal, sellers pushed price sharply lower during the bar, but buyers recovered most of that ground by the close.
What Is a Hammer Candlestick?
A hammer plots the same four prices as any candlestick, open, high, low, close, but arranges them in a distinctive way: the open and close sit close together near the top of the bar's range, forming a small body, while the low extends well below the body, creating a long lower wick. The upper wick, if present at all, is short.
That shape tells a specific intraday story: sellers were in control for most of the period, driving price down to the bar's low, but buyers stepped in and pushed price back up to close near the open. The bar itself doesn't confirm a reversal, it shows that selling pressure met resistance and was rejected, which only becomes meaningful in the context of what preceded and follows it.
How Does a Hammer Form?
Three geometric conditions define a hammer: a small real body positioned near the top of the bar's total range, a lower wick at least twice the length of the body, and little to no upper wick. All three need to hold together, a small body alone could be a doji or spinning top, and a long lower wick alone without the body sitting near the top doesn't produce the same rejection shape.
Trend context matters as much as the shape. The same geometry that forms a hammer after a downtrend is called a hanging man when it appears after an uptrend instead, and reads bearish rather than bullish. The candle's mechanics don't change; only the preceding trend does, which is why a hammer is always described relative to what came before it.
Hammer Example
The chart below shows a deterministic, illustrative example: a downtrend leading in, a hammer forming, then two possible continuations, a confirmation (the next bar closes above the hammer's high) and a failure/look-alike (the next bar closes below the hammer's low, continuing the downtrend instead). Toggle between them to see why the hammer alone doesn't decide the outcome.
How to Trade a Hammer
Confirm the downtrend context
A hammer only qualifies as a bullish setup when it forms after a meaningful downtrend, ideally at or near a known support level. The same candle shape appearing mid-range or inside an uptrend isn't a hammer signal at all, location and preceding trend do most of the interpretive work, not the shape alone.
Wait for the next bar to close above the hammer's high
A hammer by itself only shows that buyers rejected the bar's low, it does not confirm that the downtrend has actually reversed. Most approaches wait for the following bar to close above the hammer's high before treating the setup as an actionable bullish signal. A hammer that isn't followed by that close often just means the rejection didn't hold.
Define invalidation at the hammer's low
The hammer's own low is the natural invalidation level: if the next bar closes below it instead of confirming above the high, the bullish read is negated and the downtrend is treated as continuing. Defining this level before the next bar closes, not after, keeps the invalidation rule honest.
Common Hammer Mistakes
- Trading a hammer that isn't after a downtrend, the identical shape after an uptrend is a hanging man, not a hammer, and carries the opposite signal.
- Entering on the hammer bar itself, buying immediately on the hammer skips the confirmation check that separates a real rejection from a random pause.
- Ignoring wick length, a small body with a lower wick that isn't at least roughly twice the body's size is a weaker signal, closer to an ordinary small-bodied candle.
- Confusing a hammer with an inverted hammer, an inverted hammer has its long wick on top, not the bottom; see the comparison below.
Hammer vs. Similar Patterns
| Pattern | Body / wick shape | Key difference from a hammer |
|---|---|---|
| Hammer | Small body near top, long lower wick | Baseline, appears after a downtrend, bullish candidate |
| Hanging Man | Identical shape to a hammer | Same geometry, but appears after an uptrend, bearish instead of bullish |
| Inverted Hammer | Small body near bottom, long upper wick | Wick is on the opposite side; also appears after a downtrend, tentatively bullish |
| Doji | Body near zero, wicks vary | No dominant lower wick requirement; body isn't positioned at the top specifically |
Limitations of the Hammer Pattern
A hammer describes one bar's intraday rejection of lower prices, not a guaranteed reversal. It carries no information about volume, order flow, or why sellers were rejected, a hammer that forms on a scheduled news release behaves differently from one that forms on ordinary trading. It also says nothing about the size of any subsequent move: a confirmed hammer can precede a strong rally or a shallow, short-lived bounce. Like any single-bar pattern, it works best combined with trend context, support levels, and a defined confirmation and invalidation plan, not used alone.
The Proportion Is the Quality Gate
Most of the difference between a hammer worth noticing and one that is not comes down to a ratio. A lower wick shorter than roughly twice the body is closer to an ordinary small-bodied candle than to the pattern, and the rejection story attached to the name gets weaker the shorter that wick becomes. Measuring the proportion rather than matching the outline is what keeps the label from expanding.
The other requirement is entirely outside the bar. The same shape after an uptrend is a hanging man with the opposite implication, so the preceding trend is not context in a general sense, it is part of the identification. Without a downtrend in front of it, this bar is not a hammer.
Confirmation is where the pattern stops being a shape. Most approaches want the following bar to close above the hammer high, and until that happens what you have is a single session in which sellers pushed price down and buyers brought it back, which occurs often without consequence.
The bar also cannot say when the low was made or what caused it. A hammer formed around a scheduled release and one formed on ordinary trading look the same and behave differently, and the four prices carry no record of which you have.
Hammer FAQs
Is a hammer always a bullish reversal?
No. A hammer is a candidate for a bullish reversal only when it appears after a downtrend. The same shape after an uptrend is called a hanging man and reads bearish instead, context, not the shape alone, determines the signal.
What's the difference between a hammer and a hanging man?
The two have identical geometry, a small body near the top of the range with a long lower wick. The only difference is the trend that precedes them: a hammer forms after a downtrend and is read as bullish, while a hanging man forms after an uptrend and is read as bearish.
Does a hammer need confirmation?
Yes. A hammer by itself only shows that sellers pushed price down during the bar and buyers recovered most of it by the close. Traders typically wait for the next bar to close above the hammer's high before treating it as a confirmed bullish signal.
What invalidates a hammer signal?
If the next bar closes below the hammer's low instead of above its high, the tentative bullish read is invalidated and the downtrend is treated as continuing rather than reversing.
How is a hammer different from an inverted hammer?
A hammer has its small body near the top of the range with a long lower wick. An inverted hammer has its small body near the bottom of the range with a long upper wick instead. Both can appear after a downtrend and are tentatively bullish, but the wick is on the opposite side.
How long must the lower shadow be relative to the body?
The common convention is at least twice the body length, and some descriptions require three times. Nothing establishes either figure. The ratio chosen determines how many hammers a chart contains, and since the body size is itself variable, a strict ratio applied to a very small body can qualify a bar with a modest absolute shadow.
Does the body colour of a hammer matter?
Not to the definition, which specifies only the small body near the top of the range and the long lower shadow. Some descriptions prefer a bullish body on interpretive grounds, since it means the session closed above where it opened as well as far above its low. That preference is a refinement rather than a condition, and both colours are accepted as hammers.
Does a hammer require a gap down before it?
No. The requirement is a preceding downtrend, not a gap. A hammer forming after several sessions of ordinary decline satisfies the definition exactly as one following a gap does. The gap version is more visually striking and is not a separate pattern, though it does mean the session opened below the prior range before recovering.
Does including pre-market data change whether a hammer exists?
It can, since the low that creates the long shadow may have occurred in thin pre-market trading. A chart configured to include extended hours shows a deeper low and therefore a longer shadow, while a regular-session chart may show an ordinary small bar. The pattern then exists on one chart and not the other, with the difference resting on a single thinly traded print.
References
- CMT Association: Technical Analysis Body of Knowledge and Research
- CFA Institute Research and Policy Center: Investment Research
- Steve Nison, Japanese Candlestick Charting Techniques (1991), the book credited with popularizing Japanese candlestick analysis in Western markets.
- SEC Investor.gov: Introduction to Investing