
Direct Answer
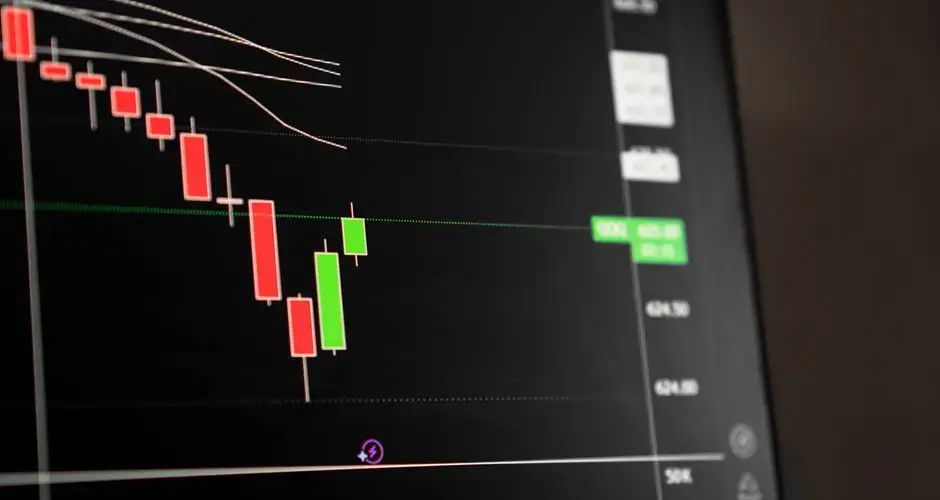
Every candlestick plots four prices for a period: open, high, low, and close. A Long Bearish Candle forms when price opens near its high, trades down through most of the session, and closes near its low, leaving a long red body and relatively small wicks above and below.
Key Takeaways
- A Long Bearish Candle is a single bar with a long red real body and relatively small wicks on both ends, showing sellers controlled most of the session's range.
- On its own, it's a strength or momentum signal, not a named reversal pattern, its implication depends entirely on where it appears.
- Appearing after an extended uptrend, it can be an early warning of a shift in control; appearing within an already-established downtrend, it usually reads as simple continuation strength.
- Elevated volume typically accompanies a genuinely decisive long candle, since broad participation is part of what makes the move meaningful.
- A Marubozu is a more extreme version with essentially no wicks at all, while a Short Bearish Candle shows the same seller control with a much smaller, weaker body.
Long Bearish Candle Candlestick Pattern: Formation, Meaning, and Signals
A Long Bearish Candle is a single candlestick with a long red real body and relatively small wicks on both ends, showing sellers controlled most of the session. On its own it's simply a strength or momentum signal rather than a named reversal pattern, what it implies depends on the trend it appears in.
What Is a Long Bearish Candle?
Every candlestick plots four prices for a period: open, high, low, and close. A Long Bearish Candle forms when price opens near its high, trades down through most of the session, and closes near its low, leaving a long red body and relatively small wicks above and below. The long body shows sellers were in control for most of the bar, with little pushback strong enough to leave a large wick on either end.
Unlike named reversal patterns that require a specific location or preceding shape, a single long bearish bar is best read as a strength or momentum descriptor. It tells you sellers dominated that particular session, it doesn't, by itself, say whether that dominance is the start of something new or a continuation of what was already happening.
How a Long Bearish Candle Forms
The defining feature is body size relative to wick size: a Long Bearish Candle has a long red body with relatively small wicks on both ends, meaning the open sat close to the session's high and the close sat close to its low. That's what separates it from other single-bar shapes, the body, not the wicks, does most of the work in the bar's range.
Because it's defined by relative body and wick size rather than by a fixed location in a trend, the same shape can appear anywhere on a chart. What changes its meaning is the context around it, the trend leading in, the level it forms at, and the volume behind it, not the bar's geometry alone.
Long Bearish Candle Example
The chart below shows a deterministic, illustrative example: an uptrend leading in, a Long Bearish Candle forming, then two possible continuations, a confirmation (price follows through lower) and a failure/look-alike (price reclaims the bar's range instead). Toggle between them to see why the bar alone doesn't decide the outcome.
How to Trade a Long Bearish Candle
After an extended uptrend
When a Long Bearish Candle appears after an extended uptrend, it can be an early warning that a shift in control is underway, the first bar where sellers, not buyers, dominated the session. That doesn't make it a confirmed reversal on its own, but it's the kind of bar traders watch for after a long run higher.
Inside an established downtrend
The same shape appearing as one bar within an already-established downtrend is usually read differently: as simple continuation strength rather than a standalone signal. In that context it confirms sellers remain in control rather than announcing a new development.
Check the volume behind it
A genuinely decisive long candle typically comes with elevated volume, since broad participation is part of what makes the move meaningful. A long red body on light volume is easier to dismiss as an outlier than one backed by a clear increase in activity.
Common Mistakes
- Treating any long red candle as automatically a reversal signal, regardless of context, on its own this is a momentum or strength descriptor, not a reversal pattern.
- Ignoring volume, a genuinely decisive long candle should typically show elevated volume; skipping that check makes it hard to tell a meaningful move from an outlier.
- Ignoring the surrounding trend, the same bar means something different after an extended uptrend than it does inside an already-established downtrend.
- Confusing it with a Marubozu, a Long Bearish Candle still has small wicks on both ends; a bar with essentially none is the more extreme Marubozu case.
Long Bearish Candle vs. Similar Patterns
| Pattern | Body size | Key difference from a Long Bearish Candle |
|---|---|---|
| Long Bearish Candle | Long, small wicks both ends | Baseline, sellers controlled most of the session |
| Marubozu | Long, essentially no wicks | A more extreme version, open equals the high and close equals the low |
| Short Bearish Candle | Small | Same red-body direction, but a much weaker signal of seller control |
Limitations of the Long Bearish Candle Pattern
A Long Bearish Candle describes one bar's range and body, not a forecast, and the false-signal risk it carries depends heavily on where it shows up. Late in an extended downtrend, an outsized red body can mark capitulation, forced selling from margin calls and panicked exits that exhausts the remaining pool of sellers and often precedes a reversal rather than confirming further downside. Inside a topping range or an already-mature downtrend, the same shape is more often distribution: measured, sustained selling that continues the move, especially when it breaks a support level on rising volume. Because the pattern carries no volume or order-flow information on its own, a long red body produced by a single large sell order or a stop-loss cascade can look identical on the chart to one built on broad, sustained selling pressure. Like any single-bar pattern, it works best combined with trend context, volume confirmation, and nearby support, not used alone, and least of all late in an already extended decline.
Capitulation or Distribution, and How You Find Out
An outsized red body has two quite different readings and they sit at different points in a decline. Late in an extended downtrend it can be capitulation: forced selling and abandoned positions clearing out the remaining supply, which more often precedes a turn than further weakness. Inside a topping range or a mature downtrend the same shape is closer to distribution, measured selling into whatever demand is available. The bar looks the same in both cases.
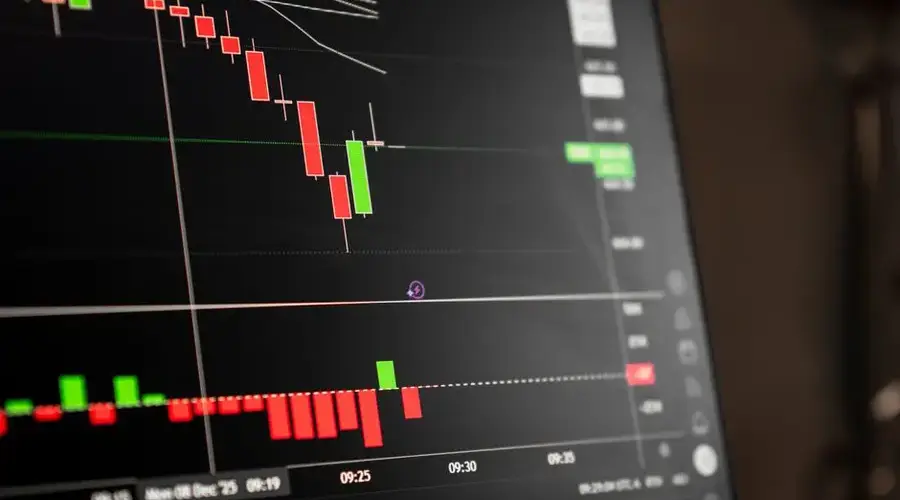
What separates them is the state of the decline in front of the bar and the behaviour after it. Capitulation follows a stretch of accelerating losses and tends to be followed by an inability to make further lows on comparable volume. Distribution appears without that acceleration and is followed by more of the same.
Volume belongs in the check either way. A long body without elevated participation is a move few people were involved in, and the exhaustion reading in particular depends on the bar representing a genuine flush rather than a quiet slide.
And appearing after an extended advance, this is a warning rather than a reversal. One session of sellers controlling the range is a change in who was in charge for a day, not a change in structure, which is why the named reversal patterns require more than a single bar.
Long Bearish Candle FAQs
Is a Long Bearish Candle always a reversal signal?
No. On its own, a Long Bearish Candle is a strength or momentum descriptor, not a named reversal pattern. Its implication depends entirely on where it appears, after an extended uptrend it can be an early warning, while inside an established downtrend it usually just reads as continuation strength.
What's the difference between a Long Bearish Candle and a Marubozu?
Both have a long red real body, but a Marubozu has essentially no wicks on either end, meaning the open was the high and the close was the low. A Long Bearish Candle has small wicks on both ends, so a Marubozu is the more extreme version of the same idea.
How is a Long Bearish Candle different from a Short Bearish Candle?
The distinction is body size. A Long Bearish Candle has a large real body relative to recent bars, showing sellers controlled most of the range. A Short Bearish Candle has a small body, which is a weaker signal of seller control over that session.
Does volume matter for a Long Bearish Candle?
Yes. A genuinely decisive long candle typically comes with elevated volume, showing broad participation behind the move. A long red body on light volume is easier to dismiss as an outlier rather than a real shift in control.
Should a Long Bearish Candle be traded by itself?
Not in isolation. Because it's a single-bar strength signal rather than a standalone pattern, it's typically read alongside the surrounding trend, volume, and nearby support or resistance rather than acted on purely because of its shape.
Long relative to what baseline?
The comparison has to be stated, since long means nothing in isolation. The usual baseline is the average body size or average true range over a recent window, which makes the classification comparable across instruments and across periods. Comparing against the immediately preceding candle answers a much more local question, and comparing against a fixed currency amount answers almost none.
Does where the candle closes within its range matter?
It separates a long bearish candle from a bearish marubozu and from a belt hold. A long body closing exactly at the low describes selling that never let up; the same body with a lower shadow describes a recovery from the session low. Both are long bearish candles under the general term, and the shadow tells you something the body length cannot.
Can one large trade create a long bearish candle?
In a thinly traded instrument, yes. A single order sweeping through what little resting size exists can move price a long way and produce a substantial body, without any change in the balance of participants. The bar looks identical to one produced by sustained selling. Checking the volume and, where available, the number of trades separates the two.
What happens to a long bearish candle after aggregation to weekly bars?
It is absorbed into the week and usually disappears as a distinct feature. A single heavy down day inside a week that otherwise drifted higher can leave the weekly bar closing up, so the candle that dominated the daily chart is visible only as a lower shadow. The information survives in reduced form and the shape does not.
References
- CMT Association: Technical Analysis Body of Knowledge and Research
- CFA Institute Research and Policy Center: Investment Research
- Steve Nison, Japanese Candlestick Charting Techniques (1991), the book credited with popularizing Japanese candlestick analysis in Western markets.
- SEC Investor.gov: Introduction to Investing