
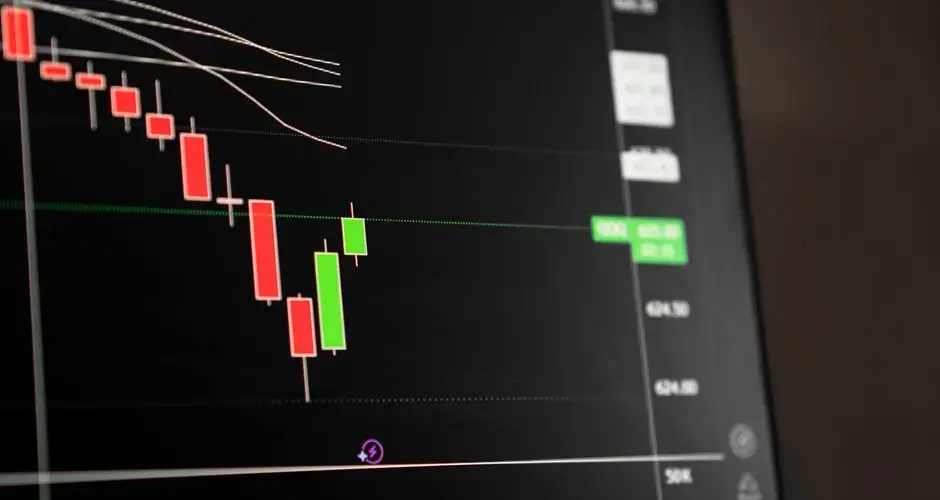
Direct Answer
A bearish separating lines pattern is made of two consecutive bars appearing in the middle of an established downtrend. The first bar is a bullish candle, a brief counter-trend bounce, that opens at a specific price.
Key Takeaways
- A bearish separating lines pattern is a two-bar continuation pattern that appears mid-downtrend, not a reversal signal.
- The first bar is a bullish candle, a brief counter-trend bounce, that opens at a specific price.
- The second bar opens at that exact same price but is a long bearish candle that continues the downtrend as if the first bar never happened.
- The defining feature is the matching open price between the two opposite-colored bars, not their closes.
- It's easy to confuse with a bearish counterattack, which instead relies on matching close prices and reverses an uptrend rather than continuing a downtrend.
Bearish Separating Lines Candlestick Pattern: Formation, Meaning, and Signals
A bearish separating lines pattern is a two-bar continuation pattern that forms mid-downtrend: a bullish counter-trend bar is followed by a long bearish bar that opens at the exact same price. It signals that the downtrend is likely to continue, treating the first bar's bounce as if it never happened.
What Is a Bearish Separating Lines Pattern?
A bearish separating lines pattern is made of two consecutive bars appearing in the middle of an established downtrend. The first bar is a bullish candle, a brief counter-trend bounce, that opens at a specific price. The second bar opens at that exact same price, but instead of continuing the bounce, it's a long bearish candle that drives price back down, resuming the downtrend as if the first bar's bounce never happened.
Because the pattern shows the downtrend reasserting itself immediately after a pause, it's read as a continuation signal, not a reversal. The shared opening price is what separates this pattern from an ordinary two-bar sequence, it's what gives the pattern its name.
How a Bearish Separating Lines Forms
The pattern requires an existing downtrend already in place. Within that downtrend, the first bar prints as bullish, buyers push price up for that bar, creating a brief counter-trend bounce. The second bar then opens at the exact same price as the first bar's open, but sellers immediately take control, producing a long bearish candle that closes well below where it opened.
The matching open price between the two bars is the defining structural feature. Because the second bar opens where the first bar started rather than where it ended, the bounce from the first bar contributes nothing to the second bar's trajectory, the downtrend picks up again from the same starting point.
Bearish Separating Lines Example
The chart below shows a deterministic, illustrative example: a downtrend leading in, the bullish bounce bar and matching-open bearish bar forming the pattern, then two possible continuations, a confirmation (the downtrend resumes) and a failure/look-alike (price fails to follow through). Toggle between them to see why the pattern alone doesn't decide the outcome.
How to Trade a Bearish Separating Lines
Read it as continuation, not reversal
Because this is a continuation pattern rather than a reversal, the trading implication is to expect the existing downtrend to keep going, not turn around. Traders looking for a trend reversal in the first bar's bounce are reading the wrong signal, the second bar's role is to negate that bounce.
Confirm the matching open, not the close
The shared opening price between the two opposite-colored bars is the defining feature of this pattern. Before treating a two-bar sequence as a bearish separating lines pattern, confirm that the open prices line up, a pattern that only matches on closing price is a different pattern entirely.
Weigh it against the surrounding trend
Since the pattern only has meaning as a continuation within an existing downtrend, its usefulness depends on that downtrend actually being in place. The same two-bar shape appearing without a clear preceding downtrend doesn't carry the same continuation implication.
Common Mistakes
- Treating the first bar in isolation as bullish, the first bar looks like a bullish signal on its own, but that reading ignores the full two-bar continuation pattern it's part of.
- Focusing on the close instead of the open, the defining feature is the matching OPEN price between the two bars, not the close.
- Ignoring whether a downtrend actually preceded the pattern, the continuation reading only applies mid-downtrend.
- Confusing it with the bearish counterattack, that pattern matches on closing price and reverses an uptrend, the opposite structure and context.
Bearish Separating Lines vs. Similar Patterns
| Pattern | Matching price | Role |
|---|---|---|
| Bearish Separating Lines | Matching opens | Continuation of a downtrend |
| Bearish Counterattack | Matching closes | Reversal of an uptrend |
| Bullish Separating Lines | Matching opens | Continuation of an uptrend, the mirror pattern |
Limitations of the Bearish Separating Lines Pattern
A bearish separating lines pattern only describes the relationship between two bars' open prices and colors, it doesn't tell a trader anything about volume, order flow, or how far the resumed downtrend will run. It also depends entirely on an existing downtrend already being in place; the same two-bar shape without that context doesn't carry the same continuation meaning. Like any pattern defined by a small number of bars, it's best combined with broader trend and level context rather than acted on alone.

The Shared Open Is the Only Link Between the Bars
Unlike most two-bar patterns, this one is not defined by containment, engulfment or a gap. The bars are connected by a single coordinate: they open at the same price. Everything else about them, their ranges, their closes, their sizes, is free. That makes it structurally unusual and easy to confuse with other two-bar sequences that happen to look similar but are defined on entirely different relationships.
The interpretation follows from that link. A counter-trend bounce, then a session that starts again from exactly where the bounce started and runs the other way, reads as the market resetting to the prevailing direction as though the bounce had not happened.
Because exact equality is rare, a tolerance is unavoidable, and stating it is what keeps the identification honest. A loose tolerance will find this pattern frequently in a market where the opens simply cluster.
It is a continuation reading that requires an existing downtrend, and like any two-bar pattern it benefits from a confirming close rather than being treated as complete on its own.
Bearish Separating Lines FAQs
Is a bearish separating lines pattern bullish or bearish?
It's a bearish continuation pattern. It appears mid-downtrend and signals that the existing downtrend is likely to continue, not reverse, despite the bullish first bar.
What makes the first bar bullish if the pattern is bearish?
The first bar is a brief counter-trend bounce within an ongoing downtrend. On its own it looks bullish, but the pattern's meaning comes from the two-bar sequence as a whole, not the first bar in isolation.
What is the defining feature of a bearish separating lines pattern?
The two bars opening at the exact same price. The first bar is bullish and the second is a long bearish bar that opens at that identical price and continues the downtrend as if the first bar never happened.
How is a bearish separating lines pattern different from a bearish counterattack?
A bearish separating lines pattern is defined by matching open prices and continues an existing downtrend. A bearish counterattack is defined by matching close prices and reverses an existing uptrend.
Does a bearish separating lines pattern only occur in downtrends?
Yes, by definition it appears mid-downtrend as a continuation signal. The mirror-image bullish version of the pattern appears mid-uptrend instead.
Do the two opening prices have to match exactly?
The classical definition says the second candle opens at the same price as the first, and exact equality is rare in liquid instruments quoted to several decimals. Implementations therefore allow a tolerance, usually expressed as a small fraction of the bar range. The tolerance chosen governs how often the pattern is found, and a strict version finds almost nothing outside coarse-tick instruments.
What three tests define bearish separating lines?
Three conditions: a first candle counter to the prevailing trend, a second candle in the direction of the trend, and their opening prices matching within a tolerance. It is one of the shorter specifications in the catalogue, which means it fires relatively often, and most of its selectivity comes from the opening-price match rather than from anything about the bodies.
How does this differ from a bearish kicker?
Both involve two candles of opposite colour with a specific opening relationship, and the relationship is different. A kicker requires the second candle to open beyond the first candle open, leaving a gap, and it is a reversal pattern. Separating lines requires the two opens to be equal, with no gap, and it is a continuation pattern. The names are similar and the geometry is not.
Does the pattern survive aggregation to a weekly chart?
It requires two consecutive weeks opening at the same price, which is considerably rarer than two consecutive days doing so, since a weekly open is a single Monday print. It also depends on which day the data provider treats as the week start. The pattern exists on weekly charts and it is uncommon enough that most weekly instances are worth verifying against the daily data.
References
- CMT Association: Technical Analysis Body of Knowledge and Research
- CFA Institute Research and Policy Center: Investment Research
- Steve Nison, Japanese Candlestick Charting Techniques (1991), the book credited with popularizing Japanese candlestick analysis in Western markets.
- SEC Investor.gov: Introduction to Investing