
Direct Answer
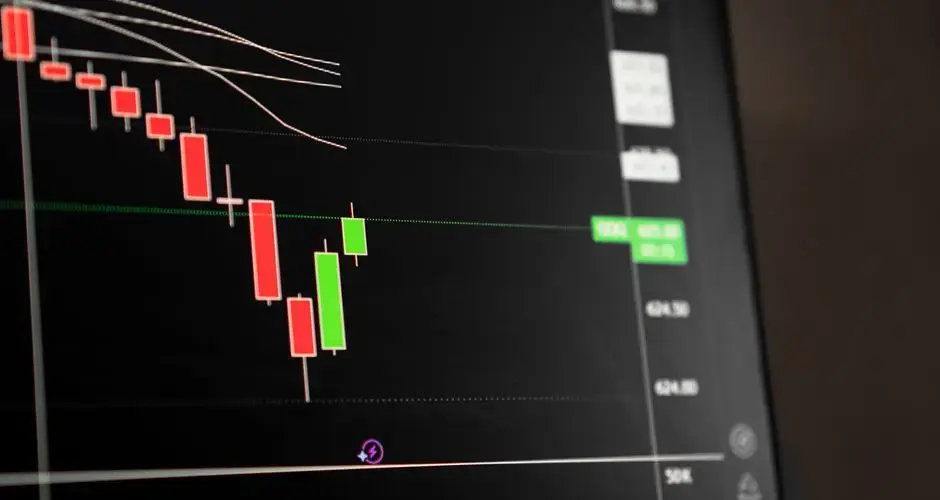
A Matching Low is a two-candle pattern that appears after a downtrend. Both candles are bearish, each closes lower than it opened, but the second bar's close lands at, or very near, the first bar's close.
Key Takeaways
- A Matching Low is a two-bar bullish reversal pattern that appears after a downtrend.
- Both candles are bearish (red), but their closes land at or very near the same price.
- The matching-closes requirement is what defines the pattern, the two bars' lows and body sizes can otherwise differ.
- It shows selling pressure failing to push price to a new low on the close, not a confirmed reversal by itself.
- Confirmation typically means the next bar closes above the second bar's high.
Matching Low Candlestick Pattern: Formation, Meaning, and Signals
A Matching Low is a two-bar bullish reversal pattern that forms after a downtrend, when two consecutive bearish candles close at or very near the same price. That matching close shows sellers failing to push price to a new low, and its meaning depends on the trend it appears in and what happens next, not the shape alone.
What Is a Matching Low?
A Matching Low is a two-candle pattern that appears after a downtrend. Both candles are bearish, each closes lower than it opened, but the second bar's close lands at, or very near, the first bar's close. That matched close is the defining feature of the pattern.
Because both bars are still bearish, a Matching Low isn't a pattern of buyers taking control outright. It's a pattern of sellers failing to make further progress: the second bearish bar tried to push the close lower than the first, and didn't. That stall in downside momentum, after an existing downtrend, is what gives the pattern its tentative bullish reading.
How a Matching Low Forms
The pattern requires a downtrend leading in, followed by two consecutive bearish candles whose closes match closely, the second bar's close sits at or very near the first bar's close. Unlike patterns built around matching lows or matching highs, a Matching Low is defined specifically by the closing prices of the two bars.
The lows of the two candles, and the size of their bodies and wicks, are not part of the definition and can differ between the two bars. What has to line up is the close of bar one and the close of bar two.
Matching Low Example
The chart below shows a deterministic, illustrative example: a downtrend leading in, the two-bar Matching Low forming, then two possible continuations, a confirmation (price follows through higher) and a failure/look-alike (price breaks the second bar's low instead). Toggle between them to see why the pattern alone doesn't decide the outcome.
How to Trade a Matching Low
Know what it requires, and what it doesn't
A Matching Low requires matching closes specifically. This is different from a Tweezer Bottom, which requires matching lows instead. The two patterns are defined by different price points on the bars and aren't interchangeable, confirming the wrong price match leads to misidentifying the pattern.
Wait for confirmation
Because the pattern only describes two bars stalling at a shared close, confirmation typically means waiting for the next bar to close above the second bar's high before treating it as an actionable bullish signal. Without that follow-through, the stall could just as easily continue into more sideways action.
Define invalidation before acting
A common invalidation level is the second bar's low: if the next bar closes below it instead of above the second bar's high, the tentative bullish read is invalidated and selling pressure is still in control.
Common Matching Low Mistakes
- Confusing it with a Tweezer Bottom, a Matching Low is defined by matching closes, while a Tweezer Bottom is defined by matching lows; they are not interchangeable.
- Assuming both candles need to be similar in size, body size and wick length are not part of the definition and can differ between the two bars.
- Trading the pattern itself, not the confirmation, entering before the next bar closes above the second bar's high skips the follow-through check.
- Ignoring the surrounding trend, a Matching Low's bullish read only makes sense after an existing downtrend, not in the middle of sideways chop.
Matching Low vs. Similar Patterns
| Pattern | Matching price point | Key difference from a Matching Low |
|---|---|---|
| Matching Low | Closes | Baseline, two bearish bars with nearly identical closes |
| Tweezer Bottom | Lows | Matches the two bars' lows instead of their closes, and typically pairs a bearish first bar with a bullish second bar |
| Homing Pigeon | None required | Second bar's body is contained within the first bar's body, no matching-price requirement at all |
Limitations of the Matching Low Pattern
A Matching Low describes a matched close between two bearish bars, not a forecast. It carries no information about volume, order flow, or why the two closes lined up, a matched close caused by a scheduled news release behaves differently from one that formed on ordinary trading. It also says nothing about magnitude: a Matching Low can precede a large move higher or none at all. Like any short-bar pattern, it works best combined with trend context and a defined confirmation and invalidation plan, not used alone.

The Name Says Low, the Definition Says Close
The pattern is called matching low and what has to match is the close. The two bars lows can differ, their bodies can differ, and their ranges can differ; the requirement is that both sessions finished at or very near the same price. Reading the name literally and comparing lows is the most direct way to misidentify it, and the two comparisons frequently disagree.
What the matching close describes is selling that failed to achieve a lower settlement on the second attempt. Both candles are red, so neither session was won by buyers, and the claim is narrower than a reversal: the decline stopped making progress at the close.
Matching, as everywhere in this family, needs a tolerance since exact equality is uncommon. Expressing it as a fraction of the bar range rather than an absolute amount keeps the identification consistent across instruments at different price levels.
And a downtrend has to precede it for the reading to mean anything. Two red sessions closing at the same price inside a range describe a level being tested twice, which is a different and more ordinary observation.
Matching Low FAQs
Is a Matching Low always a reversal signal?
No. A Matching Low only shows that two consecutive bearish bars closed at nearly the same price after a downtrend, it describes failed downside follow-through, not a guaranteed direction. Whether it turns into a reversal depends on the trend it appears in and what the following bars do.
What's the difference between a Matching Low and a Tweezer Bottom?
A Matching Low requires the two bars' closes to match closely; the lows and body sizes can otherwise differ. A Tweezer Bottom instead requires the two bars' lows to match, and typically pairs a bearish first bar with a bullish second bar. The two patterns are defined by different price points and aren't interchangeable.
Does a Matching Low need confirmation?
Yes. The two-bar pattern only shows that selling pressure failed to push the close to a new low. Traders typically wait for the next bar to close above the second bar's high before treating it as an actionable signal.
Do both candles in a Matching Low need to be similar in size?
No. The defining requirement is that the two closes land at or very near the same price. Body size, wick length, and the low of each bar can otherwise differ between the two candles.
What invalidates a Matching Low signal?
If the next bar closes below the second bar's low instead of above its high, the tentative bullish reversal reading is invalidated and selling pressure is confirmed to still be in control.
Which price is it that matches in a matching low?
The closing prices, not the lows, which is the detail most often misread given the name. Two bearish candles closing at the same price form the pattern, and their actual lows can be quite different. A tweezer bottom is the pattern where the lows match. Confusing the two leads to identifying one while looking for the other.
How exact does the match have to be?
A tolerance is unavoidable in instruments quoted to several decimals, where two closes coinciding exactly is uncommon. Implementations allow a small band, usually a fraction of the bar range or of average true range. The width of that band is the main determinant of how many matching lows a chart contains, and it is not usually stated.
Does a matching low mark a support level?
It marks a price at which two sessions ended, which is a weaker claim than a level established by repeated intraday tests. The argument for treating it as support is that two closes at the same price indicate agreement there. Whether that agreement persists is not something the two bars establish, and a support reading based on two closes rests on very little.
How does the closing auction affect a matching low?
Substantially, because both prices in the pattern are auction prints in most equity markets rather than continuous trades. The match therefore reflects two auctions settling at the same price, which involves a different mix of participants from the sessions themselves. That is a coherent observation and it is not the one the pattern description implies.
References
- CMT Association: Technical Analysis Body of Knowledge and Research
- CFA Institute Research and Policy Center: Investment Research
- Steve Nison, Japanese Candlestick Charting Techniques (1991), the book credited with popularizing Japanese candlestick analysis in Western markets.
- SEC Investor.gov: Introduction to Investing