
Direct Answer
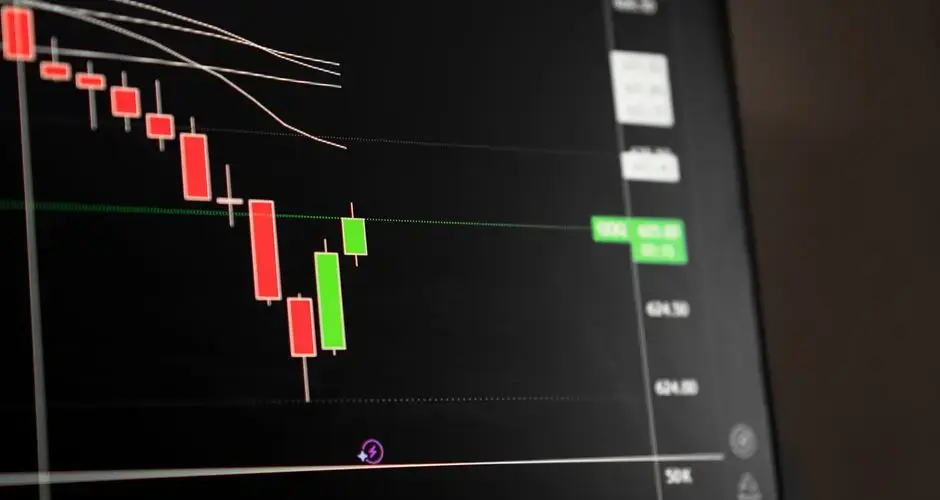
Downside Gap Three Methods is a three-candle pattern that forms within an existing downtrend. The first two bars are both long bearish candles, and there's a gap down between them, the second bar opens and trades entirely below the first bar's range.
Key Takeaways
- Downside Gap Three Methods is a three-bar bearish continuation pattern that appears during a downtrend.
- The first two bars are both long bearish candles with a gap down between them.
- The third bar is bullish, opening within the second bar's body and rallying to close the gap, filling back into the first bar's range.
- Despite the bullish third bar, the pattern implies the prevailing downtrend is expected to resume once the bounce is finished.
- It's easily confused with Downside Tasuki Gap, where the third bar only partially fills the gap instead of closing it fully.
Downside Gap Three Methods Candlestick Pattern: Formation, Meaning, and Signals
A Downside Gap Three Methods is a three-bar bearish continuation pattern in which two long bearish candles gap down, then a bullish third bar rallies enough to close the gap. It signals a temporary bounce inside an ongoing downtrend, not a reversal, the downtrend is expected to resume once the bounce is spent.
What Is a Downside Gap Three Methods?
Downside Gap Three Methods is a three-candle pattern that forms within an existing downtrend. The first two bars are both long bearish candles, and there's a gap down between them, the second bar opens and trades entirely below the first bar's range. That gap is the defining feature: it shows sellers pressing hard enough to leave a price level untraded between the two bars.
The third bar breaks from the pattern of the first two: it's bullish, and it rallies far enough to close the gap left between bars one and two, filling price back into the first bar's range. Read in isolation, that bullish close might look like a reversal. Read as part of the full three-bar sequence, it's a continuation pattern, the bounce fills the gap, and the downtrend is expected to resume from there.
How a Downside Gap Three Methods Forms
The sequence has three required parts. First, a long bearish candle within a downtrend. Second, another long bearish candle that gaps down from the first, opening and trading below the first bar's low, leaving an untraded gap between the two ranges. Third, a bullish candle that opens within the second bar's body and rallies to close the gap entirely, bringing price back into the first bar's range.
What separates this pattern from a simple gap-and-fill is the sequencing and the trend context: the gap has to form between two bearish candles inside a downtrend, and the fill has to come from a single bullish bar rather than a slow grind. If the third bar only partially closes the gap, the pattern isn't Downside Gap Three Methods, it's Downside Tasuki Gap instead.
Downside Gap Three Methods Example
The chart below shows a deterministic, illustrative example: a downtrend leading in, the gap-down pair and the gap-filling third bar, then two possible continuations, a confirmation (price resumes lower, closing back below the first bar's high) and a failure/look-alike (the bounce keeps extending instead). Toggle between them to see why the third bar's bounce alone doesn't decide the outcome.
How to Trade a Downside Gap Three Methods
Read it as continuation, not reversal
Because this is a continuation pattern, the implication is that after the third bar's brief bounce fills the gap, the prevailing downtrend is expected to resume. Traders who mistake the bullish third bar for a standalone reversal signal are reading only one bar of a three-bar structure.
Wait for confirmation
Confirmation would be the next bar closing back below the first bar's high. Until that happens, the bounce could still extend further than the pattern implies, so acting before that close adds risk that the sequence hasn't actually finished.
Know what invalidates the read
If price keeps rallying past the first bar's high instead of turning back down, the continuation read is invalidated, the bounce has become something more than a gap fill, and the downside-continuation thesis no longer holds.
Common Mistakes
- Reading the bullish third bar in isolation, treated on its own, a rallying candle looks bullish; treated as the close of a three-bar continuation pattern, it isn't.
- Confusing gap-filling with gap-continuing, a bar that stays within the gap without fully closing it is Downside Tasuki Gap, not Downside Gap Three Methods.
- Skipping the confirmation close, acting before the next bar closes below the first bar's high assumes the continuation before it's actually shown up.
- Ignoring the trend requirement, the same three-bar shape appearing outside a downtrend doesn't carry the same continuation implication.
Downside Gap Three Methods vs. Similar Patterns
| Pattern | Gap involved | Key difference |
|---|---|---|
| Downside Gap Three Methods | Yes | Baseline, third bar fully closes/fills the gap |
| Downside Tasuki Gap | Yes | Third bar only partially fills the gap, leaving it partly open |
| Falling Three Methods | No | No gap involved, three small bullish candles pause within a large first candle's range |
Limitations of the Downside Gap Three Methods Pattern
Downside Gap Three Methods describes a specific three-bar sequence, not a guarantee of what happens after it. It says nothing about volume, order flow, or why the gap formed in the first place, a gap driven by scheduled news behaves differently from one that formed on ordinary trading. It also doesn't quantify how far or how fast the resumed downtrend might move, or whether it resumes at all. Like any candlestick pattern, it's best combined with broader trend context, support/resistance levels, and a defined confirmation and invalidation plan rather than traded on its own.
Claiming Continuation After a Full Gap Fill
The third bar in this pattern rallies all the way back through the gap and into the first bar range, and the pattern still reads the decline as intact. That is worth pausing over, because a complete gap fill is normally treated as the bounce succeeding. What the pattern asserts is that the two preceding down sessions carried enough weight for one recovery bar not to change the picture.
Whether you accept that is a judgment, and the honest position is that this pattern requires more corroboration than most. What price does after the third bar, and whether the recovery extends beyond the first bar range, matters more than the shape.
It is also the pattern most easily confused with the downside tasuki gap, where the bounce explicitly stops short of filling the gap. The first two bars are identical and the third-bar condition is opposite, so marking the gap boundaries is what tells you which one you have.
As with the whole gap family, it needs session boundaries to exist and an established downtrend to be describing a continuation of anything.
Downside Gap Three Methods FAQs
Is Downside Gap Three Methods a bullish or bearish pattern?
It's a bearish continuation pattern. It forms during a downtrend and, despite ending on a bullish third bar, implies the downtrend is expected to resume rather than reverse.
Why is the third bar bullish if the pattern is bearish?
The third bar's rally is a temporary bounce that fills the gap left by the first two bars, not a reversal. The bullish close describes that one bar's price action; the pattern's overall implication is continuation of the prior downtrend.
What's the difference between Downside Gap Three Methods and Downside Tasuki Gap?
In Downside Gap Three Methods, the third bar fully closes the gap, filling back into the first bar's range. In a Downside Tasuki Gap, the third bar only partially fills the gap, leaving part of it open.
How is Downside Gap Three Methods different from Falling Three Methods?
Falling Three Methods has no gap: three small bullish candles pause within the range of one large first candle. Downside Gap Three Methods involves an actual gap down between the first two bars that the third bar then fills.
What confirms Downside Gap Three Methods as a continuation signal?
Confirmation is typically the next bar closing back below the first bar's high, showing that the third bar's bounce has failed and the downtrend has resumed.
What if the third bar closes the gap entirely?
The pattern fails on its defining condition. The third bar is supposed to rise into the gap without filling it, which is what distinguishes a pause within a decline from a genuine recovery. A close above the first bar low means the discontinuity has been erased and the continuation reading no longer has anything to rest on.
Does the pattern imply how far the decline should continue?
No projection is attached. It is a continuation pattern, so the implied expectation is that the prior direction resumes, and nothing in the three bars supplies a distance. Some practitioners use the size of the gap or of the preceding leg as a reference, and both are extensions rather than parts of the definition.
What conditions define downside gap three methods?
Two down candles separated by a gap, followed by an up candle that opens within the second body and closes within the gap without exceeding the first bar low. Four conditions, of which the last is the one implementations disagree about most, since exactly how far into the gap the third bar may close is not specified.
Is a weekly downside gap three methods realistic?
It requires a weekly gap, which needs an entire week to open below the previous week range, and that is uncommon. When it does occur the structure describes three weeks of trading and the gap represents a much larger dislocation. Most instances found on weekly data turn out to use a loosened gap definition rather than a true weekly gap.
References
- CMT Association: Technical Analysis Body of Knowledge and Research
- CFA Institute Research and Policy Center: Investment Research
- Steve Nison, Japanese Candlestick Charting Techniques (1991), the book credited with popularizing Japanese candlestick analysis in Western markets.
- SEC Investor.gov: Introduction to Investing