
Direct Answer
A bull trap is a false breakout above a resistance level that quickly reverses lower, trapping the traders who bought the breakout expecting continuation higher. The breakout bar itself can look identical to a genuine breakout, so the shape alone never identifies one: the difference only shows up in the bars that follow. Most approaches wait for a confirmed close back below the resistance level before treating the move as a completed bull trap rather than a breakout that is simply pausing.
Key Takeaways
- A bull trap is a false breakout above resistance that quickly reverses lower, trapping traders who bought the breakout expecting continuation higher.
- The breakout bar itself can look identical to a genuine breakout, the difference only shows up in what happens on the bars right after it.
- Most approaches wait for a confirmed close back below the resistance level before treating the move as a completed bull trap rather than a breakout that is simply pausing.
- A close back above the breakout bar's own high generally invalidates the bull trap reading and favors a genuine breakout retesting old resistance as new support.
- A bull trap is the directional mirror of a bear trap, and a specific case of the broader false-breakout pattern.
Bull Trap
A bull trap is a false breakout above a resistance level that quickly reverses lower, trapping the traders who bought the breakout on the expectation that price would keep climbing. Price pushes above resistance, sometimes with enough conviction to look like the real thing, then fails within a few bars and drops back beneath the level, leaving breakout buyers holding losing positions.
What Is a Bull Trap?
Resistance is a price level where selling pressure has previously overwhelmed buying pressure, stalling or reversing an advance. When price finally closes above that level, traders watching for a breakout often buy, expecting the level to flip from resistance into support and the advance to continue. A bull trap is what happens when that expectation is wrong: price closes above resistance, draws in breakout buyers, and then reverses lower within a short number of bars, trapping those buyers above a level that has now failed to hold.
The term describes the outcome for the trader, not a distinct chart shape. At the moment the breakout bar closes, a bull trap is visually indistinguishable from a genuine breakout. What separates the two is only visible afterward, in whether the following bars extend the move or reverse it.
How a Bull Trap Forms
A bull trap typically forms in three steps. First, price approaches a resistance level that has already been tested once or more, building a pool of buy orders and stop-loss orders (from short sellers) clustered just above it. Second, a bar closes above that resistance, appearing to confirm a breakout and pulling in momentum buyers who did not want to miss the move. Third, instead of continuing higher, the next bars reverse sharply, closing back below resistance and continuing downward, leaving the breakout buyers with an entry above a level price could no longer hold.
As with any false breakout, the level's prior credibility matters. A resistance level that has already turned back two or three prior advances is watched by more traders and defended by more sellers, so a bull trap at that kind of level is generally read as more significant than one at a level that only just formed.
Bull Trap Example
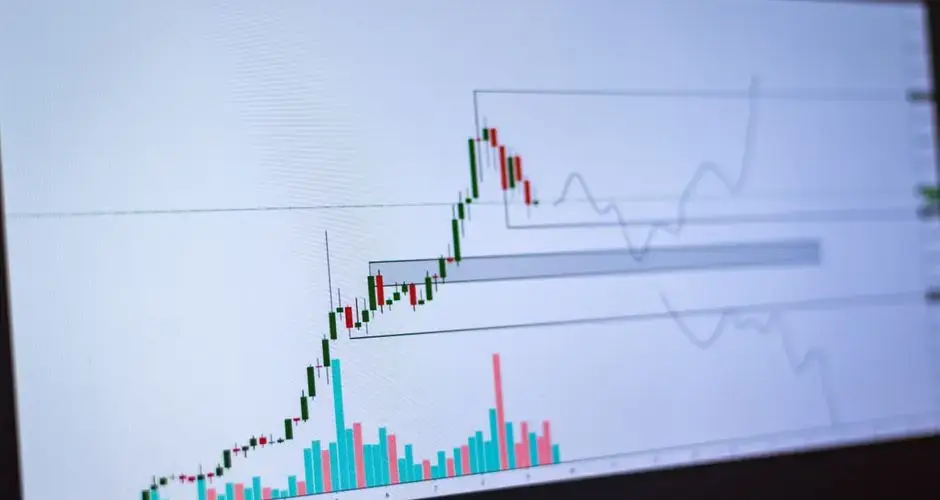
The chart below shows a deterministic, illustrative example: price tests resistance twice, then breaks above it on a bar that looks like a genuine breakout. Toggle between two possible continuations: confirmation (the very next bars reverse sharply back below resistance and keep falling, the bull trap plays out) and failure/look-alike (price holds above resistance and continues higher instead, a genuine breakout, not a trap).
How to Trade Around a Bull Trap
Don't buy the breakout bar alone
Because a bull trap and a genuine breakout look the same at the close of the breakout bar, entering purely because price closed above resistance offers no way to distinguish the two. Waiting to see how the next one or two bars behave, whether the move extends or reverses, removes some of that ambiguity, at the cost of a less favorable entry price.

Wait for the close back below the level
Most approaches treat a bull trap as confirmed once price closes back below the resistance level within a short number of bars of the breakout, ideally with volume or momentum evidence behind the reversal, rather than reacting to an intrabar dip alone.
Define invalidation before acting
A common invalidation point is the breakout bar's own high: if price later closes back above that high, the bull trap reading is invalidated and the move looks more like a genuine breakout retesting old resistance as new support. Setting this level before the next bar closes, not after, keeps the invalidation rule honest.
Common Bull Trap Mistakes
- Buying the breakout bar without waiting for confirmation, the breakout bar alone cannot distinguish a bull trap from a genuine breakout.
- Treating every failed breakout as a bull trap, a single wick above resistance that never closes above it is a rejection, not a completed bull trap.
- Ignoring how well-defended the resistance level was, a trap at a level tested only once carries less weight than one at a level defended repeatedly.
- No predefined invalidation level, without a level at which the bull trap reading is abandoned, a genuine breakout that briefly pulls back can be misread as a trap and traded incorrectly.
Bull Trap vs. Similar Patterns
| Term | What it emphasizes | Key difference from a bull trap |
|---|---|---|
| Bull trap | A false breakout above resistance that reverses lower | Baseline, buyers who entered on the breakout are trapped above a level that failed to hold |
| Bear trap | A false breakdown below support that reverses higher | The directional mirror of a bull trap, sellers, not buyers, are the ones trapped |
| False breakout | Any breakout that fails to hold, in either direction | Broader umbrella term; a bull trap is the specific bullish-breakout, bearish-reversal case |
| Swing failure pattern | The testable structure: a new swing beyond a prior one, then a close-back | A formal, swing-point definition of a failed breakout, a bull trap can qualify as one if it meets that structure |
Limitations of Bull Trap Analysis
A bull trap is only identifiable with the benefit of the bars that come after the breakout, at the moment resistance is broken, there is no way to know in advance whether the move will hold or fail. Reading a bull trap from price alone also says nothing about why the reversal happened; any explanation involving trapped buyers or deliberate stop-hunting is an inference from price behavior, not an observed fact. Like any single price-action pattern. It is best combined with the resistance level's prior credibility, broader trend context, and a defined confirmation and invalidation plan, rather than traded in isolation.
You Cannot Spot This One in Advance
The breakout bar of a bull trap and the breakout bar of a genuine move can be indistinguishable. Same close above resistance, same conviction, sometimes same volume. The pattern only exists once the following bars have reversed it, which means there is no technique for identifying a bull trap while it is happening. Anyone offering one is describing a breakout they later found out about.

So the decision this page actually changes is not about spotting traps. It is about how you enter breakouts at all, knowing that a share of them will do this. Waiting for a close back inside before calling it a trap, and waiting for something beyond the breakout bar before entering, are the same discipline seen from the two sides.
One distinction worth being strict about: a wick above resistance that never closes above it is a rejection, not a trap. The pattern requires a completed breakout to have failed, and collapsing the two makes almost every level test look like a bull trap in review.
Whatever you conclude, decide the invalidation before entering. Without a level at which the read is wrong, a trade taken on a suspected trap has no defined cost and the reversal that was supposed to be brief has nowhere to stop.
Bull Trap FAQs
What is a bull trap?
A bull trap is a false breakout above a resistance level that quickly reverses lower, trapping the traders who bought the breakout expecting it to continue higher. Price briefly moves above resistance, often enough to draw in breakout buyers, before failing and dropping back beneath the level.
How is a bull trap different from a genuine breakout?
A genuine breakout holds above resistance and continues higher on subsequent bars, often with expanding volume behind it. A bull trap looks identical at the moment of the break, price closes above resistance, but the very next bars reverse sharply and close back below the level, and the move continues downward instead of extending the breakout.
How do traders confirm a bull trap before acting on it?
Most approaches wait for a confirmed close back below the resistance level within a few bars of the breakout, rather than reacting to the breakout bar alone. A reversal that closes back under the level, especially with momentum or volume evidence, is treated as stronger confirmation than a single wick or an intrabar dip.
What invalidates a bull trap reading?
If price closes back above the breakout bar's own high after the pullback, the bull trap reading is invalidated and the move more likely represents a genuine breakout that is simply retesting the old resistance level as new support before continuing higher.
Is a bull trap the same as a bear trap?
No. A bull trap is a false breakout above resistance that reverses lower, trapping buyers. A bear trap is the mirror image: a false breakdown below support that reverses higher, trapping sellers who shorted the breakdown. Both describe a failed breakout, just in opposite directions.
Does a bull trap require a real level to have been broken?
It requires one for the term to add anything. Without a level, what happened is a rally that failed, which is an unremarkable and constant occurrence. The trap framing depends on there having been a break that induced participants to act, and that in turn depends on the level having been visible and defended beforehand. A level drawn afterwards to explain the failure produces a trap by construction.
How is a bull trap different from a distribution pattern?
Timescale and structure. A bull trap is a short event: a break above a level followed by a reversal back below it, usually within a few bars. Distribution describes an extended period, often weeks, in which supply is absorbed at a range of prices with several failed advances. A bull trap can be one episode within a distribution range, and a single trap is not evidence of one.
Are bull traps more common in some instruments than others?
They occur more readily where a small amount of buying can push price through a level and where liquidity behind that level is thin, which describes low-float securities and thinly traded instruments generally. That is a tendency arising from market structure rather than a rule, and it means a break in such an instrument carries less evidential weight than the same break in a deeply traded one.
Does the size of the overshoot matter?
A marginal poke above the level and a decisive move that runs before reversing are different situations, even though both end below the level. The marginal case may reflect nothing more than the spread and a few orders. The decisive one means price traded meaningfully higher and was rejected, which involves a larger population of participants now offside. Recording the overshoot distance keeps the two distinguishable.