

Direct Answer
A trend is, by definition, a period where one side, buyers or sellers, is consistently overpowering the other, producing a sequence of higher highs and higher lows, or lower highs and lower lows. Consolidation is what happens when that imbalance temporarily disappears: price stops making meaningful progress and instead oscillates between a relatively stable support level and a relatively stable resistance level.
Key Takeaways
- Consolidation is a period where price moves sideways within a defined range after a trend, reflecting a balance between buyers and sellers before the next directional move.
- The range's support and resistance boundaries, not the trend that preceded them, are treated as the decision point for what happens next.
- Consolidation does not by itself indicate direction: price can break out as a continuation of the prior trend or reverse against it.
- Most approaches wait for a decisive close beyond the range, ideally with expanding volume, rather than acting on a single wick past the boundary.
- A consolidation range and a liquidity sweep are related but different: a consolidation is an extended sideways phase, while a liquidity sweep is a single short move beyond a level that quickly reverses.
Consolidation Patterns in Trading
Consolidation is a period where price moves sideways within a defined range after a trend, reflecting a balance between buyers and sellers before the next directional move. Instead of extending the prior trend, price repeatedly tests a similar band of highs and lows, neither side able to push decisively through until the balance eventually breaks.
What Is Consolidation?
A trend is, by definition, a period where one side, buyers or sellers, is consistently overpowering the other, producing a sequence of higher highs and higher lows, or lower highs and lower lows. Consolidation is what happens when that imbalance temporarily disappears: price stops making meaningful progress and instead oscillates between a relatively stable support level and a relatively stable resistance level.
This sideways behavior reflects a rough equilibrium. Buyers are willing to step in near the range's lower boundary, and sellers are willing to step in near its upper boundary, so neither side accumulates enough pressure to force a sustained move beyond either edge. The range itself becomes visible on the chart as a horizontal band of overlapping bars with no clear net progress in either direction.
How Consolidation Forms
Consolidation commonly follows an established trend. After a sustained move, participants who drove that trend often pause, some take profit, some wait for confirmation before adding more, and new participants on the other side start testing whether the move has further room to run. That pause in conviction is what produces the sideways, overlapping price action.
As the range develops, its support and resistance boundaries get tested multiple times. Each test that holds reinforces the level and adds to the pool of resting orders around it, while a test that fails to hold, a decisive close beyond the boundary, is generally read as the resolution of the consolidation, sending price into its next directional move.
Consolidation Example
The chart below shows a deterministic, illustrative example: a clear uptrend leads into a run of overlapping bars confined to a horizontal band, making no net progress. Toggle between two possible resolutions: a continuation (price breaks above resistance and extends the prior trend) and a failure/look-alike (price instead breaks down below support, reversing the prior trend).
How to Trade Consolidation
Mark the range before guessing the outcome
The first step is identifying the range's boundaries, the support and resistance levels price is repeatedly testing, rather than guessing which direction it will eventually break. A well-tested range with several clean touches on both sides is generally a more reliable reference than a loosely defined one with only a bar or two of overlap.

Wait for a decisive close beyond the boundary
Because a single wick beyond support or resistance is often just another test of the level rather than a completed breakout, most approaches wait for a confirmed close beyond the boundary, ideally accompanied by expanding volume or momentum, before treating the range as resolved.
Respect that direction is not predetermined
A consolidation after an uptrend can resolve as a continuation higher or a reversal lower, the range itself doesn't guarantee either outcome. Planning for both scenarios, with a defined entry and invalidation level on each side of the range, keeps a trader from assuming the prior trend must resume.
Common Consolidation Mistakes
- Assuming the prior trend must resume, consolidation reflects balance, not a guaranteed continuation; the range can just as easily resolve against the prior trend.
- Acting on the first wick beyond the range, entering before a decisive close beyond support or resistance risks reacting to a level test that ultimately holds.
- Trading in the middle of the range, the middle of a consolidation offers the least favorable risk/reward; most of the useful information is at the boundaries.
- Ignoring how well-tested the boundaries are, a range with only one or two touches on a side is less established than one repeatedly defended, and the two shouldn't be treated with equal confidence.
Consolidation vs. Similar Concepts
| Term | What it emphasizes | Key difference from consolidation |
|---|---|---|
| Consolidation | An extended sideways phase after a trend, bounded by support and resistance | Baseline, describes a period of price action, not a single bar or move |
| Trend | A sustained sequence of higher highs/lows or lower highs/lows | The opposite behavior: consistent directional progress rather than sideways balance |
| Liquidity sweep | A single sharp move beyond a level that quickly reverses | A short, single-move event rather than an extended range; a consolidation's boundary can end with one |
| Breakout | Price exiting a defined range with a decisive close | The resolution event that ends a consolidation, not the sideways phase itself |
Limitations of Consolidation Analysis
Consolidation is read from price structure alone, it identifies a balance between buyers and sellers, but it does not reveal which side will eventually win or when the range will resolve. A range that has held for a long time can still break in either direction, and a boundary that has been defended repeatedly in the past can still fail on the next test. Like other price action concepts, it's best used alongside broader trend context and a defined plan for both possible outcomes, not as a standalone directional signal.
The Middle of the Range Is the Worst Place to Act
Inside a consolidation, the boundaries are where information lives and the middle is where it is scarcest. A position opened in the centre of the range has resistance a certain distance above and support a certain distance below, with no edge in either direction and nothing nearby that would tell you the idea was wrong. Trades taken there tend to be trades taken out of impatience with the range rather than because of it.
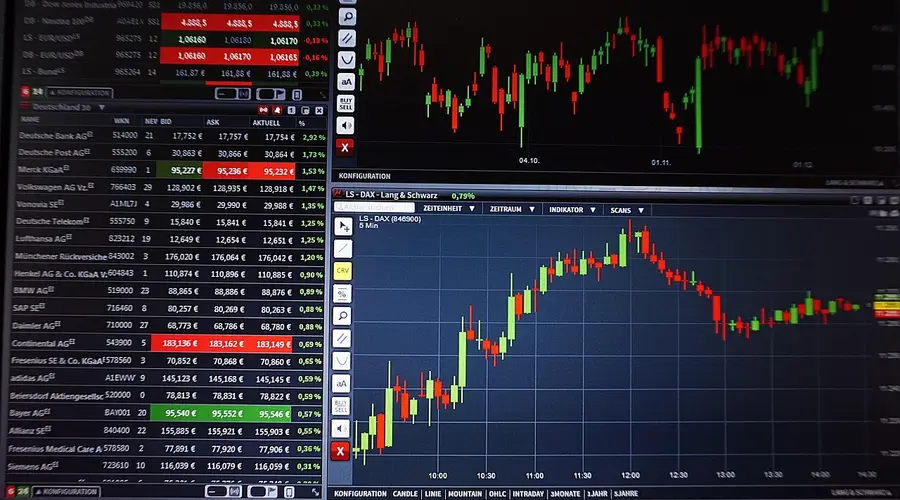
The other reframe worth making is that the prior trend stops being the reference point. Once price is consolidating, the range support and resistance are the decision points, and a range after an advance can resolve downward just as readily as it continues. Assuming the previous direction must resume imports a conclusion the balance in the range does not support.
When a boundary is tested, the wick and the close are different events. A probe beyond support or resistance that recovers is a level test that held, and acting on it means trading a break that has not happened.
And ranges are not on a schedule. One that has held for a long time can break in either direction, and a boundary defended repeatedly in the past can fail on the next test with no change in how it looked beforehand.
Consolidation FAQs
What is consolidation in trading?
Consolidation is a period where price moves sideways within a defined range after a trend, reflecting a balance between buyers and sellers before the next directional move. Instead of making new highs or new lows, price repeatedly tests a similar band of levels.
How long does a consolidation phase usually last?
There is no fixed duration. A consolidation can resolve after a handful of bars or persist for weeks, depending on the timeframe and how evenly matched buyers and sellers are at that level. What matters for reading it is the range's boundaries and how price behaves at them, not a specific bar count.
Does consolidation always lead to a breakout in the same direction as the prior trend?
No. Consolidation only shows that buyers and sellers are temporarily balanced; it does not by itself indicate which way price will resolve. Price can break out in the direction of the prior trend (continuation) or reverse against it, so the range's boundaries are treated as the decision point, not the trend that preceded them.
How is consolidation different from a liquidity sweep?
Consolidation describes an extended period of sideways, overlapping price action within a range. A liquidity sweep is a single short, sharp move that pushes briefly beyond a level before reversing. A consolidation range can end with a liquidity sweep of its own support or resistance, but the two terms describe different things: one is a phase, the other is a single move.
What confirms that price has actually broken out of consolidation?
Most approaches look for a decisive close beyond the range's support or resistance, ideally with expanding volume or momentum, rather than a single wick beyond the boundary. A wick that closes back inside the range is often just another test of the level, not a completed breakout.
What separates consolidation from a range?
Usage rather than geometry. Consolidation implies a pause within an established trend, so the word carries an expectation about what preceded it and often about what follows. Range is neutral and describes the structure without that context. The same sideways stretch is called consolidation by someone who read the prior move as a trend and a range by someone who did not.
How is consolidation measured?
By two quantities: the width of the sideways structure relative to the size of the preceding move, and its duration. A narrow structure after a large advance is a tight consolidation; one nearly as wide as the move that preceded it is closer to a reversal in progress. Expressing width as a fraction of the prior leg rather than in currency makes the comparison portable.
Does volume behave characteristically during consolidation?
Declining volume through a consolidation is the traditional description and it is a tendency rather than a requirement. Consolidations occur on flat and on rising volume as well. The claim is worth checking on the specific chart rather than assumed, since a consolidation on heavy volume describes a different situation from one where participation simply faded.
Can consolidation occur without a prior trend?
Then it is a base or a range, not a consolidation, because there is nothing being consolidated. The distinction matters for the expectation attached: consolidation carries an implication of continuation that a base does not. A sideways structure arriving after a long decline and one arriving after a strong advance are described differently for that reason, even where the shapes are identical.