
Direct Answer
Trend exhaustion is the condition where a rally or decline runs out of the momentum and participation that were driving it, even though price may still be pushing to new extremes. It's typically flagged by a combination of signals, momentum divergence, shrinking price ranges, a volume climax, or repeated failed attempts to extend beyond a prior high or low. Exhaustion is a warning that a trend is vulnerable, not proof that a reversal is about to happen.
Key Takeaways
- Trend exhaustion means the momentum and participation behind a trend are fading, even if price is still extending.
- It is a composite read built from several signals together, not a single formula or indicator value.
- Common signals include momentum divergence, climax volume, shrinking bar ranges, and failed breakouts/breakdowns.
- Exhaustion does not mean a reversal is confirmed, it can resolve into consolidation, a pause, or a continuation.
- Climax volume refers to an unusually large, wide-range bar late in a trend, often tied to capitulation or late-chasing behavior.
- Traders typically wait for price confirmation (a broken trendline or support/resistance level) before acting on exhaustion signals.
- Exhaustion reads are subjective and can appear on any timeframe, so context and trend maturity matter.
- Combining multiple exhaustion signals reduces (but never eliminates) false signals compared to relying on one alone.
What Is Trend Exhaustion?
A healthy trend is generally supported by consistent participation: each new high in an uptrend (or new low in a downtrend) is accompanied by comparable or expanding momentum, volume, and range. Trend exhaustion describes what happens when that support starts to erode, price keeps pushing toward a new extreme, but the underlying force behind each push is progressively weaker than the one before it.
Unlike a single named indicator with one calculation, trend exhaustion is a concept traders assess by combining several observations: whether momentum oscillators are confirming new price extremes, whether volume is expanding or contracting into the move, whether the size of each new price swing is growing or shrinking, and whether price is able to close beyond prior extremes or keeps failing to do so.
Common Signals of Trend Exhaustion
- Momentum divergence. Price sets a new high or low, but a momentum oscillator (such as RSI or MACD) fails to confirm it with a matching new extreme, a sign that the pace of buying or selling pressure is fading even as price extends.
- Climax volume. A sharp, outsized spike in volume, often paired with a wide-range bar, appears late in an extended trend. This is commonly read as late participants rushing in or existing positions being unwound rapidly, which can leave fewer buyers or sellers to sustain the move.
- Shrinking swing size. Each successive push in the trend's direction covers less price distance than the one before it, suggesting diminishing conviction.
- Failed breakouts or breakdowns. Price attempts to clear a prior high or low and cannot hold beyond it, reversing back inside the prior range.
- Narrowing range and declining volume together. The trend continues in direction, but daily/period ranges compress and volume tapers off, indicating fewer participants are actively pushing price further.
Consider a hypothetical illustration: a stock trends from $60 to $90 over several weeks. Early advances move roughly $8-$10 per leg on strong, expanding volume. In the final leg from $85 to $90, the advance takes twice as long, volume during the push is noticeably below the levels seen on the earlier legs, and RSI, which peaked near 82 on the move through $80, only reaches 60 on the move to $90. Price also attempts to clear $90 twice within a few sessions and fails both times, closing back below it. Taken together, slowing advance, fading volume, non-confirming momentum, and a failed breakout, this hypothetical pattern illustrates several exhaustion signals appearing at once, though it does not by itself confirm that a reversal will follow.
Why Trend Exhaustion Matters
Trends are ultimately a reflection of sustained buying or selling pressure. When that pressure starts to fade, visible in weakening momentum readings, contracting participation, or an inability to extend beyond prior extremes, it can mean the trend is being carried by a narrower and narrower group of participants. Traders who track exhaustion signals are essentially trying to gauge whether a trend still has broad support behind it or is being propped up by dwindling conviction.
This matters for a few practical reasons. Traders holding a position in the direction of a mature trend may tighten stops or take partial profits when multiple exhaustion signals appear together, rather than assuming the trend will continue unchecked. Traders looking to enter counter-trend may treat exhaustion as an early warning to watch for, while still waiting for price to actually confirm a shift in structure before acting. In both cases, exhaustion signals are treated as one input for risk management and timing, not as a standalone entry or exit trigger.
Limitations and Common Mistakes
- Treating exhaustion as a precise reversal signal. Exhaustion flags weakening momentum, not a specific price or time at which a trend will turn, trends can persist, consolidate, or resume after exhaustion signals appear.
- Acting on a single signal in isolation. One divergence reading or one high-volume bar is common noise; traders generally look for several exhaustion signals converging before treating the read as meaningful.
- Ignoring trend context and maturity. Exhaustion signals appearing early in a new trend carry less weight than the same signals appearing after an extended, well-developed move.
- Skipping price confirmation. Entering a counter-trend trade purely on exhaustion signals, without waiting for a broken trendline or support/resistance level, exposes a trader to a trend that simply resumes.
- Subjectivity in identifying swings and climaxes. What counts as a "climax" volume bar or a meaningfully shrinking swing is judgment-based and can vary between traders and timeframes.
- Overlooking timeframe mismatch. Exhaustion signals on a short intraday chart do not carry the same significance as exhaustion signals on a daily or weekly chart, and mixing the two can produce inconsistent conclusions.
Exhaustion Has Three Endings, Not One
The word suggests a reversal, and reversal is only one of the ways an exhausted trend resolves. It can also consolidate sideways while participation rebuilds, or simply resume after a pause. Planning for one outcome out of three is where most of the damage comes from, because a counter-trend position taken on exhaustion signals loses in two of those cases and only pays in one.
It is also a composite judgment rather than a reading. There is no exhaustion value, no threshold, and no setting: it is an impression assembled from momentum divergence, a volume climax, narrowing ranges and failed attempts at new extremes. That makes it genuinely useful for organising what you are seeing and impossible to specify precisely enough to test, and it means two analysts can disagree about whether it is present without either being careless.
Two conditions raise the weight it deserves. Several signals converging rather than one, since a single divergence or one heavy bar is ordinary noise. And an extended, mature move underneath it, because the same signals early in a fresh trend are describing a trend that has barely started rather than one running out.
Whatever the read, wait for price to do something structural before acting on it. A broken trendline, a lost support level, a failure to make the next high: these are the events that turn a suspicion about momentum into evidence about direction, and entering ahead of them means fighting a trend that may simply carry on.
Frequently Asked Questions
What is trend exhaustion?
Trend exhaustion is a condition where a prevailing price trend loses the participation and momentum that were driving it, typically shown through shrinking price ranges, fading volume or momentum-indicator readings, and an inability to sustain new highs or lows. It signals that the trend may be running out of fuel, not that a reversal is confirmed.
What are the main signs of trend exhaustion?
Commonly cited signs include momentum divergence (price extends but an oscillator like RSI does not), a climax bar with unusually high volume and range, progressively smaller price advances or declines on each new push, and failed attempts to break beyond a prior extreme.
Is trend exhaustion the same as a trend reversal?
No. Trend exhaustion describes weakening momentum within an existing trend, while a reversal is a confirmed change in trend direction. Exhaustion can resolve into consolidation, a pause before the trend resumes, or a reversal, traders generally wait for price confirmation before assuming which outcome will occur.
What is climax volume and how does it relate to exhaustion?
Climax volume refers to a sharp, unusually large spike in trading volume, often accompanying a wide-range price bar near the end of an extended trend. It is commonly interpreted as a sign that late participants are rushing in or capitulating, which can leave fewer buyers or sellers left to extend the move further.
How do traders confirm trend exhaustion before acting?
Traders commonly look for multiple exhaustion signals to line up together, such as momentum divergence plus a failed breakout, and then wait for a break of near-term trendline or support/resistance structure before treating the exhaustion signal as actionable, rather than trading on a single indicator reading alone.
What is a parabolic advance and how does it relate to exhaustion?
A parabolic advance is one in which the rate of increase itself keeps rising, so the price curve steepens rather than continuing at a constant slope. It is discussed alongside exhaustion because such a slope cannot be sustained indefinitely by arithmetic. What the shape does not supply is timing: an advance can steepen far further than seems plausible before anything changes.
Can exhaustion signals appear repeatedly without a top forming?
Frequently, and this is the practical difficulty with the concept. The markers usually cited, including divergence, climactic volume and extended readings, can each occur several times during a long advance. Counting how many previous exhaustion signals the same trend has already produced is one of the more useful checks available, and it is rarely done because each signal is assessed on its own.
Is exhaustion the same thing as divergence?
No. Divergence is one class of evidence sometimes offered in support of an exhaustion read, alongside volume behaviour and range characteristics. Exhaustion is the broader claim that the move is running out of participation. Using the words interchangeably narrows the concept to one indicator comparison, which is both weaker evidence and easier to find than the full argument requires.
Does exhaustion look the same at a low as at a high?
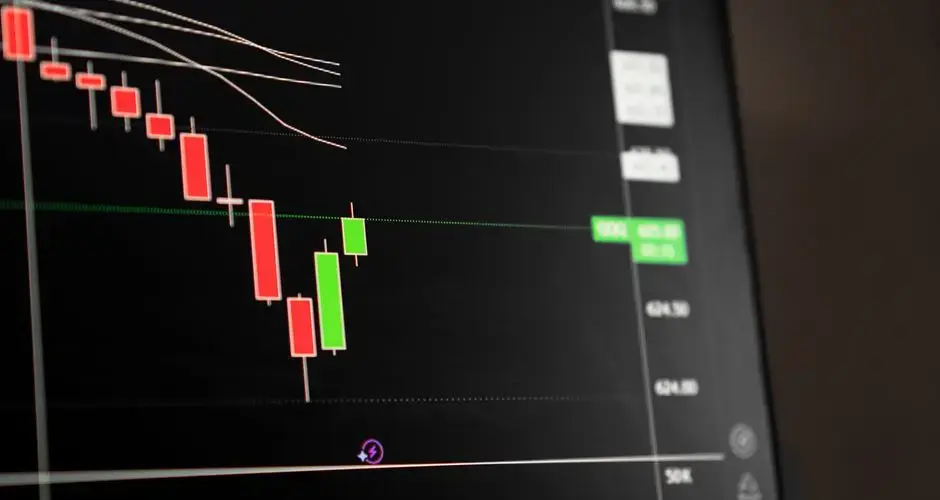
The two ends are not symmetric. Declines often end in a compressed, high-volume capitulation, because forced selling and stop-outs concentrate activity. Advances more often end with a gradual fading of participation over a longer stretch. That asymmetry means the visual markers described for a top do not transfer to a bottom, and applying the same checklist to both misses what is actually distinctive about each.
References
Disclaimer
This page is for educational purposes only and does not constitute investment, financial, or trading advice. Trend exhaustion signals reflect historical price and volume behavior and do not guarantee future results; the example on this page uses illustrative, hypothetical figures, not live or historical market data. Swoopr Investment is not a licensed investment advisor; consult a qualified professional before making investment decisions.