
Direct Answer
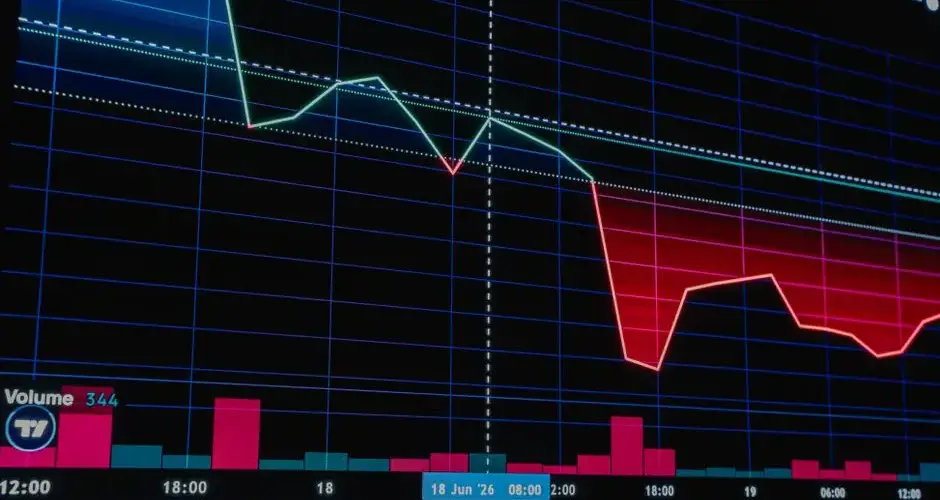
A downtrend is a sustained price pattern in which each swing high is lower than the prior swing high, and each swing low is lower than the prior swing low. This repeating sequence of lower highs and lower lows indicates that sellers are consistently overpowering buyers over the period being analyzed. Traders typically look for at least two of each, two lower highs and two lower lows, before treating a downtrend as structurally established rather than a temporary dip.
Key Takeaways
- A downtrend is defined by a repeating sequence of lower highs and lower lows.
- It reflects persistent selling pressure, sellers stepping in before buyers can reclaim prior highs.
- A downtrend line connects successive swing highs and often acts as dynamic resistance.
- Downtrends can appear on any timeframe, intraday, daily, weekly, and can nest inside a larger uptrend as a correction.
- A single lower low is not enough to confirm a downtrend; traders generally want a repeating pattern.
- Downtrends often coincide with declining volume on bounces and expanding volume on breakdowns, though this is not universal.
- A sustained close back above the downtrend line, or a higher high forming, is a common signal traders watch for potential trend change.
- Downtrends describe past and current price structure, they are not a guarantee that price will keep falling.
What Is a Downtrend?
In technical analysis, a trend describes the general direction price is moving over a given period, and that direction is read from the sequence of swing highs and swing lows a chart produces. A downtrend is the bearish case: instead of price building on previous strength, each rally stalls below the prior rally's peak, and each decline pushes below the prior decline's trough. The result is a descending staircase pattern, lower highs, lower lows, that repeats as long as the trend remains intact.
The mechanism behind that pattern is straightforward. Every time price rallies, sellers step in earlier and in greater size than the last time, capping the advance below the previous high. Every time price falls, buyers fail to defend the previous low, and price pushes to a new low instead. That imbalance, sellers acting with more conviction than buyers at each turn, is what a downtrend visually represents.
How to Identify and Draw a Downtrend
Identifying a downtrend starts with marking swing highs and swing lows on a chart, the local peaks and troughs where price visibly changed direction. A downtrend is confirmed once at least two successive swing highs are each lower than the one before, and at least two successive swing lows are each lower than the one before. A single lower low, on its own, can just be normal volatility inside an uptrend or a sideways range; the repeating pattern is what separates a genuine downtrend from noise.
Once a downtrend is established, many traders draw a downtrend line by connecting the swing highs with a straight line sloping downward, ideally using three or more touchpoints for a more reliable line. That line frequently acts as dynamic resistance: as long as price keeps failing to close above it, the downtrend is considered intact. A sustained close above the downtrend line, particularly one accompanied by a break above the most recent swing high, is one of the more commonly cited signals that the downtrend may be ending.
Consider a hypothetical illustration. A stock trades in the following hypothetical sequence over several weeks: it rallies to $92, pulls back to $84, rallies again to only $88 (a lower high), then falls to $80 (a lower low), rallies to $85 (another lower high), and falls to $76 (another lower low). That sequence, $92 to $88 to $85 on the highs, $84 to $80 to $76 on the lows, is a textbook downtrend: two consecutive lower highs and two consecutive lower lows. A downtrend line drawn across the $92, $88, and $85 highs would slope downward and, in this hypothetical, would need a sustained close above roughly $85-88 before traders would start questioning whether the downtrend was ending.
Why Downtrends Matter
Trend direction shapes how traders approach a market. In a confirmed downtrend, many traders favor strategies aligned with continued selling pressure, such as looking for short entries on bounces toward resistance, over strategies that assume price will keep rising. Downtrends also inform risk management: a lower high can serve as a logical stop-loss reference for a short position, while a break of a prior swing low can confirm that the trend is continuing rather than reversing.
Downtrend structure also matters for risk-averse, long-only investors, since it can flag periods where buying dips is statistically less favorable than it would be inside an uptrend. And because a downtrend line represents a level where sellers have repeatedly won control, a decisive break above it is often treated as one of the earliest structural clues that selling pressure may be fading, well before other indicators or fundamental narratives catch up.
Limitations and Common Mistakes
- Calling a downtrend too early. One lower low is not a downtrend, treating a single pullback as trend-confirming can lead to premature bearish positioning inside what is still an uptrend.
- Subjective swing-point selection. Identifying swing highs and lows involves judgment; different traders drawing lines on the same chart can disagree on whether a downtrend is intact.
- Treating the downtrend line as precise support/resistance. Trendlines are approximations, not exact price levels, expecting a clean bounce or rejection at the exact line often leads to poor timing.
- Ignoring timeframe context. A downtrend on a 15-minute chart can exist entirely inside a daily uptrend; conflating signals across timeframes causes contradictory conclusions.
- Assuming a downtrend will continue indefinitely. Downtrends end, sometimes abruptly, and past lower highs and lower lows say nothing certain about future price direction.
- Fighting the trend without confirmation. Trying to pick the exact bottom of a downtrend before any structural evidence of reversal (a higher high, a break of the downtrend line) is a common source of losses.
Count Before You Name It
The gap between a pullback and a downtrend is a counting exercise, and skipping it is the most expensive habit in this area. One lower low is a lower low. A downtrend needs the pattern to repeat, which is why the usual working rule asks for two lower highs and two lower lows before the label goes on. Positioning bearishly on the first one means positioning against an uptrend that has not stopped.
The counting has a soft edge that is worth acknowledging. Deciding which pivots qualify as swing points is a judgment, and two people can look at the same chart and disagree about whether the structure is intact. Writing down what counts as a swing, even roughly, makes your own reads consistent over time, which is the part you can control.
Two habits protect against the other common errors. Read the trendline as an approximation rather than a price: it connects successive highs and marks a region where sellers have been active, and expecting a clean rejection at the exact line produces poor entries and needless stops. And check the timeframe, because a fully valid downtrend on a fifteen-minute chart can be one ordinary pullback inside a daily uptrend.
Finally, treat the structure as description rather than forecast. Lower highs and lower lows record what sellers have done, not what they will keep doing, and downtrends end, sometimes without the courtesy of a warning bar.
Frequently Asked Questions
What is a downtrend?
A downtrend is a sustained price pattern in which each successive swing high is lower than the one before it, and each successive swing low is lower than the one before it. This sequence of lower highs and lower lows indicates that sellers are consistently overpowering buyers over the period in question.
How many lower highs and lower lows are needed to confirm a downtrend?
There is no single official threshold, but many traders look for at least two consecutive lower highs and two consecutive lower lows before treating a downtrend as established, since a single lower low could simply be normal volatility rather than a genuine trend change.
What is the difference between a downtrend and a pullback in an uptrend?
A pullback is a temporary, typically shorter counter-move within a larger uptrend that still respects the uptrend's prior swing lows. A downtrend is a structural change in which price begins making both lower highs and lower lows, breaking below prior support rather than holding it.
How do traders draw a downtrend line?
A downtrend line is drawn by connecting at least two, and ideally three or more, successive swing highs with a straight line sloping downward. The resulting line often acts as dynamic resistance; a sustained close above it is one signal traders watch for a possible trend change.
Does a downtrend guarantee price will keep falling?
No. A downtrend describes established price behavior, not a forecast. Downtrends can reverse, consolidate, or accelerate, and past lower highs and lower lows do not guarantee future price direction.
Does a downtrend need a trendline to exist?
No. The definition is the sequence of lower highs and lower lows, which is present in the price data whether or not anything is drawn on the chart. A trendline is a visual aid for locating where that sequence would be violated, and it introduces choices about which points to connect. A downtrend can be entirely well defined on a chart with no lines on it at all.
What is a bear market rally?
A counter-trend advance within an established downtrend that does not break the sequence of lower highs. The term is applied afterwards, since while it is happening it is indistinguishable from the first leg of a reversal. That ambiguity is the point: what separates a rally from a reversal is whether the next high exceeds the previous one, and that is not knowable until it happens.
Do downtrends move differently from uptrends?
Return data has long shown a tendency for declines to be faster and to come with higher volatility than advances of comparable size. That is a statistical tendency across markets and periods rather than a rule about any individual case. Practically it means the same trend definition produces wider bars, more frequent penetrations of levels, and shorter time from start to finish on the downside.
Can a downtrend end without reversing?
Yes, and this is the outcome most trend frameworks handle least well. A downtrend can flatten into a range, where the sequence of lower lows stops without a sequence of higher highs beginning. Nothing about that transition looks like a reversal, and a framework that recognises only two states will label the range as one or the other depending on the noise within it.
References
Disclaimer
This page is for educational purposes only and does not constitute investment, financial, or trading advice. Trend structure reflects historical price behavior and does not guarantee future results; any prices or examples shown on this page are hypothetical and illustrative, not live or historical market data. Swoopr Investment is not a licensed investment advisor; consult a qualified professional before making investment decisions.