
Direct Answer
A volume dry-up is a period of unusually low trading volume, often occurring after a sharp price move or during a tight consolidation. Some technical analysts interpret it as a sign that selling or buying pressure has been exhausted and the security may be setting up for its next directional move. A volume dry-up on its own doesn't indicate direction, only that current participation has thinned out relative to normal.
Key Takeaways
- A volume dry-up is a stretch of below-average trading volume, typically appearing after a sharp move or during a tight consolidation.
- Some analysts interpret it as exhaustion of the pressure that drove the prior move, potentially setting up the next directional swing.
- Low volume alone never indicates direction - it only shows that participation has thinned, not which way the eventual move will break.
- A dry-up is judged relative to that specific security's own recent volume, not against a fixed universal threshold.
- Many analysts wait for volume to expand again before treating the eventual breakout or breakdown as meaningful.
- A single quiet session is not the same as a sustained dry-up - context and duration both matter.
What Does a Volume Dry-Up Look Like?
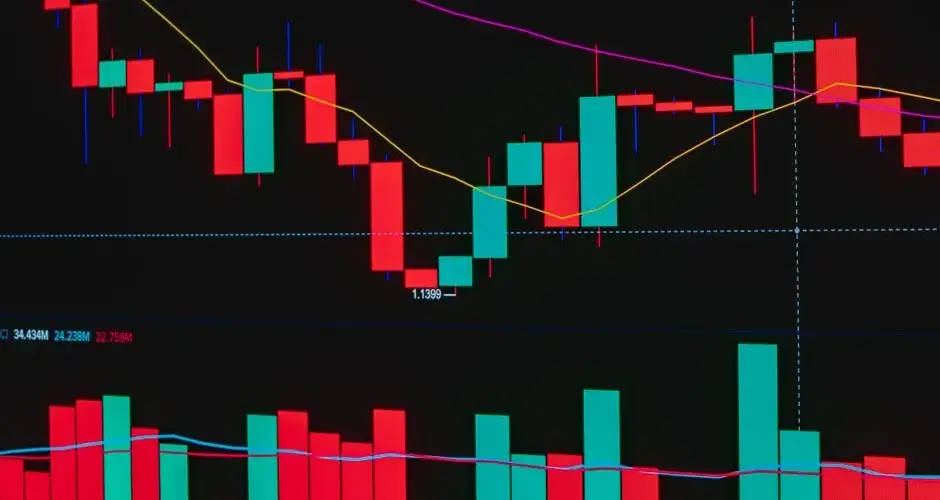
Volume measures how many shares, contracts, or units of a security changed hands over a given period. Most sessions cluster around a security's typical range of daily volume, shaped by its float, its index membership, and everyday interest from traders and investors. A volume dry-up is what happens when that everyday participation drops off - fewer shares trade than usual, often for several consecutive sessions, even while the price itself may barely move.
Two settings are commonly associated with dry-ups. The first is right after a sharp price move: a gap up or down, an earnings reaction, or a fast breakout can pull in a burst of volume as participants react, and once that reaction plays out, remaining volume can fall off quickly as the immediate catalyst is absorbed. The second is during a tight consolidation: a price range narrows, day-to-day movement compresses, and volume can shrink alongside it as fewer participants see a reason to transact at the current price.
Because "unusual" is relative, a dry-up is normally assessed against that same security's own recent volume history rather than a fixed number applied across every stock or crypto asset - a level that would be unremarkable for a thinly traded small-cap could still represent a dry-up for a heavily traded large-cap, and vice versa.
Why Some Analysts Read a Dry-Up as Exhaustion
The reasoning some technical analysts apply to a volume dry-up centers on participant behavior rather than the price itself. After a sharp move, the participants most motivated to act on the immediate catalyst - the news, the earnings surprise, the breakout - have often already traded. What's left is a smaller pool of remaining holders who may be less willing to transact at the current price, whether because they're waiting for more information, holding for a longer-term view, or simply less active in the near term. That reduced willingness to trade can show up as declining volume even while price stabilizes or drifts sideways.
Under that view, a dry-up is read as a sign that the selling (or buying) pressure that drove the prior move has been largely worked through, leaving the security in a lower-conviction holding pattern until a new catalyst or a fresh wave of participation arrives. Some analysts pair this with price structure - watching whether the price holds a support or resistance level during the low-volume period - and treat a subsequent volume increase, in either direction, as the signal that new participation has entered and the pause may be ending.
It's worth being explicit about what this reasoning does not claim. A volume dry-up does not say whether the next move will be up or down, only that current participation is thin relative to normal. Two securities can show an identical volume dry-up and then move in opposite directions once volume returns - the dry-up describes the state of participation, not the outcome.
An Illustrative Scenario
Consider a hypothetical stock that gaps up sharply on an earnings surprise, trading several times its typical daily volume that session and the next. Over the following two weeks, the price settles into a narrow range near the post-earnings high, and daily volume steadily contracts back toward - or below - the stock's normal range. A technical analyst watching this pattern might note the volume dry-up as consistent with the initial earnings-reaction buyers and sellers having largely finished trading, leaving the stock in a quieter holding pattern.

What the analyst would not do, based on the dry-up alone, is conclude that the stock is now more likely to break higher than lower (or the reverse). The dry-up is a statement about thinned participation, not a forecast. Many analysts using this pattern would wait to see which direction the price moves once volume picks back up - a breakout on rising volume, or a breakdown on rising volume - before treating the resolution as meaningful, since a move on continued low volume is generally given less weight than one confirmed by renewed participation.
Limitations and Common Mistakes
| Mistake | Why it's a problem | Better practice |
|---|---|---|
| Treating a dry-up as a directional signal | Low volume only shows thinned participation - it says nothing about whether the next move will be up or down. | Pair a dry-up with price structure and wait for a volume-confirmed move before drawing a directional conclusion. |
| Confusing one quiet session with a genuine dry-up | A single low-volume day can just reflect a slow news day or holiday-adjacent session, not a meaningful pattern. | Look for a sustained multi-day or multi-week contraction relative to that security's own recent volume, not one isolated session. |
| Applying a universal volume threshold | "Low" volume for a heavily traded large-cap can be ordinary volume for a thinly traded small-cap, and vice versa. | Judge volume relative to the same security's own recent history, not a fixed number carried across different securities. |
| Ignoring low liquidity's effect on execution | Thin volume can widen bid-ask spreads and increase slippage, independent of whatever the dry-up may or may not be signaling. | Account for reduced liquidity in order sizing and order type before acting on a low-volume setup. |
A volume dry-up is also just one input among many technical analysts use. It doesn't account for company- or asset-specific fundamentals, broader market conditions, or upcoming scheduled catalysts (earnings, macro data releases) that could abruptly end a quiet period regardless of what the volume pattern implied.
Quiet Can Mean Coiled or Simply Uninteresting
A dry-up is one of the weakest kinds of evidence a chart offers, because it is evidence of absence. The exhaustion reading, that the participants motivated by the last catalyst have already traded and the remaining holders are unwilling to transact at these prices, is a plausible story. So is the far duller one: interest moved elsewhere and nothing is coming. The volume pattern is identical in both cases.

This is why the discipline attached to the idea is waiting for expansion. A dry-up sets up a question, and the answer arrives when volume returns alongside a directional move. Acting during the quiet period means positioning on a hypothesis that has produced no confirming evidence yet, and the low volume itself means an exit may be harder than the entry was.
Direction is the other thing the pattern cannot supply. Contraction after a sharp advance can precede a continuation or a give-back, and nothing in a falling volume line leans either way. Any directional expectation you carry into the resolution came from somewhere else and should be labelled as such.
Two practical qualifiers. Judge quiet against the security own normal range, not a universal figure, and distinguish a single dull session from a sustained contraction, since only the second describes the setup. And check the calendar for a scheduled catalyst, because an earnings date can end a quiet stretch abruptly and in a direction the volume pattern never hinted at.
Frequently Asked Questions
What is a volume dry-up?
A volume dry-up is a period of unusually low trading volume, often occurring after a sharp price move or during a tight consolidation. Some technical analysts interpret it as a sign that selling or buying pressure has been exhausted and the security may be setting up for its next directional move, but low volume alone does not indicate which direction that move will take.
Does a volume dry-up predict which direction a stock will move?
No. A volume dry-up on its own doesn't indicate direction, only that current participation has thinned out relative to normal. Analysts who use volume dry-ups typically wait for a subsequent move accompanied by a volume increase before treating the eventual direction as meaningful.
Why does volume shrink after a sharp price move?
After a sharp move, participants who wanted to act on the immediate catalyst have often already traded, and the remaining holders may be less willing to transact at current prices. That reduced willingness to trade can show up as declining volume even while the price itself stabilizes or drifts sideways.
How is a volume dry-up different from a normal quiet trading day?
A single quiet session can simply reflect a slow news day or a broader market lull. A volume dry-up refers to a more sustained stretch of below-average volume, typically viewed in the context of recent volume levels for that specific security, which makes an isolated low-volume day different from a multi-day or multi-week contraction pattern.
Should a volume dry-up be used as a standalone trading signal?
Most technical analysts treat a volume dry-up as context rather than a standalone signal, pairing it with price structure, support and resistance levels, or a subsequent volume expansion before drawing a conclusion. Using it alone risks reading meaning into what may simply be a temporary lull in participation.
How is a dry-up measured against the average?
Usually as a fraction of a trailing average, such as volume falling below half of the recent norm for a defined number of sessions. Both the fraction and the duration are parameters with no derivation, and they determine how often the condition occurs. A dry-up identified with one pair of settings will not appear with another, so the settings belong with the observation.
Do dry-ups happen before scheduled events?
Commonly, because participants wait for information they know is coming. Low volume ahead of a results announcement or a policy decision is the expected behaviour rather than an observation about supply and demand. Any reading of a dry-up as coiling or accumulation needs to rule out the simpler explanation first, which requires checking the calendar rather than the chart.
How does a volume dry-up relate to a volatility contraction?
They frequently occur together and they measure different things. A dry-up is about participation, counting how much traded. A volatility contraction is about range, measuring how far price moved. A market can be quiet on both, or narrow on heavy volume, which is a distinctly different situation. Treating the two as the same observation loses the case where they disagree.
Can a dry-up be a data problem rather than a market condition?
Yes, and it is worth ruling out. A shortened session, a feed outage, a change in which venues a provider consolidates, or a symbol change after a corporate action can all produce a volume figure that looks like a collapse in activity. The check is quick: compare against another data source or against a related instrument that should have been similarly affected.