

Direct Answer
The Force Index, developed by Alexander Elder, multiplies a period's price change by that period's volume to produce a single reading meant to capture the "force," or conviction, behind a price move. A large positive reading points to a strong up move on heavy volume, a large negative reading points to a strong down move on heavy volume, and readings near zero point to low-conviction price action.
Key Takeaways
- The Force Index multiplies a period's price change by that period's volume, combining two data sources into a single value.
- A large positive reading indicates a strong up move on heavy volume; a large negative reading indicates a strong down move on heavy volume.
- Readings near zero indicate low-conviction price action, whether that's a small price change, light volume, or both.
- The Force Index was developed by trader and author Alexander Elder, who combined price and volume concepts across several of his indicators.
- Because it's unbounded, the raw value is only meaningful relative to that same instrument's own historical range, not comparable across different stocks or assets.
- A short-period Force Index is choppy and reacts quickly; smoothing it (commonly with a moving average) trades responsiveness for a steadier read.
- Like any volume-based indicator, it reflects only price and volume that already happened, it does not forecast direction, magnitude, or timing of future moves.
What Is the Force Index?
The Force Index is a volume-based indicator developed by Alexander Elder that combines two separate pieces of market data, price change and volume, into one reading. The idea behind it is straightforward: a price move backed by heavy trading volume reflects more conviction from market participants than the same size price move on light volume.
Instead of looking at price and volume as two separate charts, the Force Index multiplies them together for each period, producing a single line that swings above and below zero. A large positive value says a strong up move happened on heavy volume; a large negative value says a strong down move happened on heavy volume; a value near zero says the period's price-and-volume combination showed little conviction, regardless of which direction price nudged.
How the Force Index Is Calculated
Force Index = (Close − Previous Close) × Volume
Each period's Force Index compares the current close to the prior period's close to get the price change, then multiplies that price change by the current period's volume. A single-period Force Index like this tends to be noisy, so it's common to smooth the raw values with a moving average (a short exponential moving average is a frequently cited approach) to produce a steadier line, the smoothing period is a separate choice from the underlying price-and-volume calculation itself.

Worked example: Suppose a stock closes at $102.00 today after closing at $100.00 the prior period, on volume of 2,000,000 shares. Force Index = ($102.00 − $100.00) × 2,000,000 = $4,000,000, a large positive reading, consistent with a strong up move on heavy volume. Now suppose the next period the stock closes at $101.50 (down $0.50) on volume of only 300,000 shares. Force Index = (−$0.50) × 300,000 = −$150,000, a small negative reading, consistent with low-conviction price action rather than a forceful reversal. Comparing the two shows how the same-direction price move (or lack of one) can produce very different Force Index magnitudes depending on volume.
How to Read the Force Index
Sign and magnitude together
The sign of the Force Index shows direction, positive for an up period, negative for a down period, but the magnitude is what carries the "conviction" interpretation. A small positive or negative reading suggests a quiet period regardless of which way price ticked; a large positive or negative reading suggests a period where price and volume moved together forcefully in one direction.
Divergence from price
Some traders watch for cases where price makes a new high or low but the Force Index doesn't confirm it with a comparably large reading, a potential sign that the move lacked the volume support of prior moves in the same direction. Like any divergence-based read. This is a description of a pattern in the data, not a signal that reliably precedes a particular outcome.
Smoothing choice
A raw, single-period Force Index can whipsaw sharply because both price change and volume can spike or drop from one period to the next. Applying a moving average to the raw values reduces that noise at the cost of some responsiveness, the same speed-versus-smoothness trade-off that applies to most technical indicators.
Limitations and Common Mistakes
- Treating a single large reading as a standalone trade signal, the Force Index describes conviction over one completed period; it doesn't account for trend context, support/resistance, or fundamentals.
- Comparing raw Force Index values across different stocks, because both price scale and typical volume vary enormously between instruments, an absolute value is only meaningful relative to that same instrument's own historical range.
- Ignoring the effect of smoothing period choice, an unsmoothed Force Index and a heavily smoothed one can look quite different even though they're built from the same underlying price and volume data.
- Assuming volume data is complete or consistent, reported volume can vary by data source and, for some instruments, may reflect only a portion of total trading activity (for example, exchange-reported volume for a security also traded off-exchange).
- Reading conviction as a prediction, a large Force Index reading describes what already happened during that period; it does not forecast the size, direction, or timing of the next move.
One Number Made of Two Things
The Force Index multiplies price change by volume, which means a large reading can be produced two entirely different ways: a big move on ordinary volume, or a small move on enormous volume. The single number does not distinguish them, and the interpretations differ. Before reading conviction into a large value, look at which factor supplied it, because a modest drift on a rebalancing day is not the same event as a decisive move on normal participation.
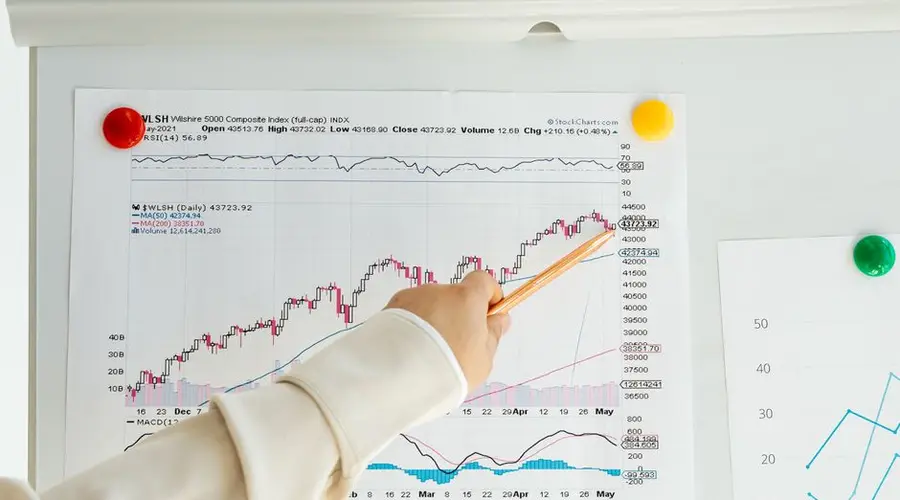
Because the product is unbounded and both inputs vary hugely between instruments, an absolute value carries no meaning across a watchlist. A reading that is extreme for one stock is unremarkable for a higher-priced or more heavily traded one. Compare a Force Index only against that same instrument own history, and treat any cross-instrument ranking of raw values as noise.
The smoothing choice is more consequential than it looks. A single-period Force Index is deliberately raw and jumps around; smoothing it with a short exponential average produces a quite different-looking line from the same data. Neither is the true version, and a signal that appears in one and not the other is a statement about the smoothing rather than about the market.
One data caveat worth carrying: reported volume can differ by source, and for instruments trading across multiple venues a single feed may capture only part of total activity. Since volume is half the calculation, an incomplete feed does not just add noise, it scales the whole reading.
Force Index FAQs
What does the Force Index measure?
It measures the conviction behind a price move by multiplying the period's price change by that period's volume. A large positive reading indicates a strong up move on heavy volume; a large negative reading indicates a strong down move on heavy volume; readings near zero indicate low-conviction price action.
Who created the Force Index?
The Force Index was developed by Alexander Elder, a trader and author known for combining price, volume, and momentum concepts into practical trading tools.
What does a negative Force Index mean?
A negative reading means price fell during that period. The larger the negative number, the more volume accompanied the decline, which is generally read as stronger conviction behind the down move than a small negative reading on light volume.
Does a high Force Index reading predict a reversal?
No. The Force Index describes how much price-and-volume force accompanied a completed period; it does not forecast direction, magnitude, or timing of future price moves on its own.
Is the Force Index the same as On-Balance Volume?
No. On-Balance Volume adds or subtracts an entire period's volume based only on whether price closed up or down, ignoring the size of the move. The Force Index instead multiplies volume by the actual price change, so both the direction and the magnitude of the move affect the reading.
What smoothing periods are used with the Force Index?
Alexander Elder presented it with two: a very short smoothing of around two periods for reading short-term shifts, and a longer one of around thirteen for the underlying trend in the measure. They answer different questions rather than being fast and slow versions of one reading, and reference material discussing Force Index signals usually assumes one of them without saying which.
Why is the Force Index scale not comparable between securities?
Because it multiplies a price change in currency units by a share volume, so its magnitude depends on both the price level and the typical volume of the instrument. A heavily traded low-priced security and a thinly traded high-priced one produce values orders of magnitude apart with no difference in what happened. Only the sign and the shape are portable; the level is not.
Can the unsmoothed Force Index be read directly?
It is extremely noisy, because a single period value is the product of two quantities that both fluctuate sharply from bar to bar. The raw series flips sign constantly and its magnitude jumps with every volume spike. Smoothing is effectively part of the indicator rather than an optional addition, which is why it is almost never plotted in its one-period form.
Does the Force Index use the bar range or the close-to-close change?
The close-to-close change, which means everything that happened within the bar is invisible to it. A session that fell substantially and recovered to close slightly higher contributes a small positive value multiplied by what may have been enormous volume. The indicator records the net outcome and the participation, and it has no way to represent the path between them.