
Direct Answer
Volume divergence occurs when price continues moving in a given direction - a continuing rally or a continuing decline - while volume trends in the opposite direction, such as declining volume during a rally that keeps making new highs. Some technical analysts interpret this as a sign that fewer participants are actively supporting the move, meaning the trend may be losing underlying conviction even though price itself hasn't turned yet.
Key Takeaways
- Volume divergence is price and volume trending in opposite directions - most commonly, declining volume while price keeps rallying or keeps declining.
- It's read as a possible sign of fading participation: fewer buyers or sellers actively pushing a trend that's still extending on the chart.
- It applies to both uptrends and downtrends - declining volume on new highs, or declining volume on new lows.
- Like other divergence concepts, it's probabilistic, not predictive - a trend can persist on thinning volume for an extended period with no immediate reversal.
- Volume divergence compares price against raw traded volume, not against a momentum indicator derived from price.
- It's typically used as one confirming or warning input alongside price structure and other tools, not as a standalone trade trigger.
What Is Volume Divergence?
Volume is the count of shares, contracts, or units traded over a given period, and it's often treated as a rough proxy for how many participants are actively involved in a price move. When a trend is broad-based - genuinely drawing in new buyers in a rally, or new sellers in a decline - volume is generally expected to hold up or expand as the trend continues, since more participants are transacting at each new price level.
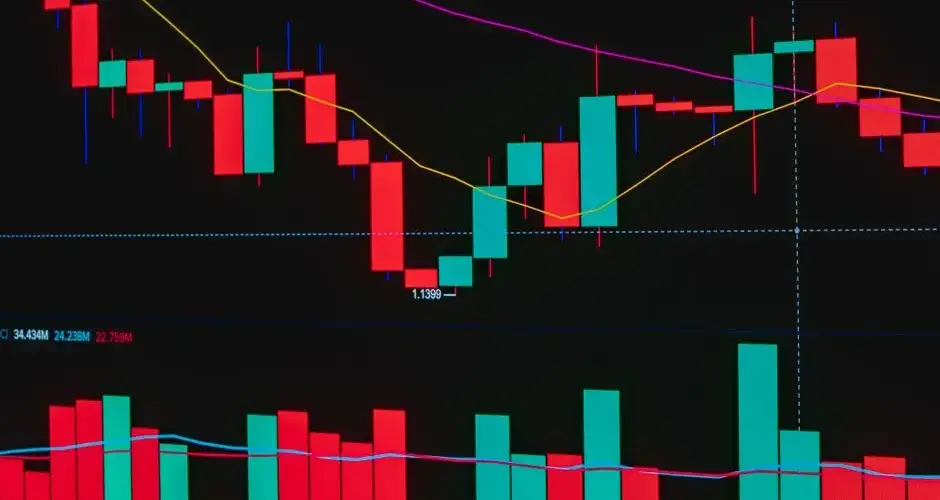
Volume divergence is what happens when that expectation breaks down: price keeps making progress in its existing direction, but the volume behind each successive push shrinks. In a rally, that looks like each new high being made on lower volume than the high before it. In a decline, it looks like each new low being made on lower volume than the low before it. The price chart alone doesn't show this - it takes overlaying a volume pane or histogram beneath the price chart to see the two series moving apart.
How to Read a Volume Divergence
Reading a volume divergence is a comparison exercise, not a single data point. It generally involves looking at a sequence of price extremes - two or more swing highs in an uptrend, or two or more swing lows in a downtrend - and comparing the volume associated with each one.

- Bearish-leaning divergence in an uptrend: price sets a higher high than the prior swing, but volume on that new high is lower than volume on the prior high. Some analysts read this as fewer buyers stepping in to extend the rally.
- Bullish-leaning divergence in a downtrend: price sets a lower low than the prior swing, but volume on that new low is lower than volume on the prior low. Some analysts read this as fewer sellers stepping in to extend the decline.
Because volume itself is noisy day to day, this comparison is typically made across swing points or over a smoothed window rather than by reading single-session volume in isolation. A single quiet trading day doesn't establish a divergence on its own - it's the pattern across successive price extremes that matters.
Why Volume Divergence Matters - and Where It Fits
The core idea behind volume divergence is that price alone can be misleading about the health of a trend. Price only tells you which direction the last trade moved; it doesn't tell you how many participants were involved in getting there or how convinced they were. Volume adds that second dimension - it's a way of asking whether a trend is being carried by broad participation or by a thinning group of traders still pushing it along, sometimes described informally as "less conviction" behind the move.
Some technical analysts weigh a volume divergence more heavily when it appears alongside other signs of a stalling trend, such as narrowing price ranges, a slowing rate of new highs or lows, or divergence in a momentum oscillator like RSI or MACD occurring at the same time. A price trend backed by strong, expanding volume is generally viewed as more resilient than one that keeps extending on progressively thinner participation - though "more resilient" describes a tendency, not a guarantee, and divergence readings vary somewhat depending on which volume measure and time frame an analyst uses.
It's worth being explicit about what volume divergence is not: it's not a timestamp for when a reversal will happen, and it's not evidence that a reversal will happen at all. As with other divergence concepts in technical analysis, it's a probabilistic signal that can persist - sometimes for an extended stretch of time - without the trend ever actually turning.
Common Mistakes and Limitations
| Mistake | Why it's a problem | Better practice |
|---|---|---|
| Treating divergence as a timing signal | A trend can extend on shrinking volume for a long stretch before anything changes, so entering or exiting purely on the divergence reading alone can be premature. | Use divergence as a caution flag inside a broader plan with its own entry, stop, and risk sizing - not as the trigger itself. |
| Reading one day's volume in isolation | Daily volume is noisy - one thin session near a swing point doesn't establish a divergence pattern. | Compare volume across a sequence of swing highs or lows, or use a smoothed volume measure, before concluding a divergence exists. |
| Ignoring context around the volume decline | Volume naturally thins around holidays, low-liquidity periods, or single-stock events unrelated to the trend's underlying conviction. | Check whether a volume drop coincides with a broader liquidity lull before attributing it to fading trend conviction. |
| Treating it as reliable in isolation across every market and timeframe | Reported volume can differ meaningfully by venue and instrument (consolidated tape versus a single exchange, spot versus futures, or across fragmented crypto exchanges), which affects how comparable divergence readings are. | Confirm which volume source is being measured and be more cautious drawing conclusions when the data is thin or fragmented. |
Fading Participation or Just a Quiet Calendar
Volume divergence differs from the momentum kind in one respect that changes how carefully you have to read it. Momentum divergence compares price to an indicator derived from price, so both sides move for the same reasons. Volume divergence compares price to raw traded volume, which responds to things that have nothing to do with conviction at all.

That is the specific trap. Declining volume across a series of higher highs looks like thinning participation, and it also looks exactly like a holiday week, a half-session, a summer lull or a market whose attention has moved to a different sector. Before reading fading conviction into the pattern, check whether the calendar explains it, because the chart cannot distinguish the two.
The comparison itself needs discipline as well. This is a sequence read, not a single observation: two or more swing highs with the volume that accompanied each, or two or more swing lows. Comparing a swing high against an arbitrary quiet stretch in between produces a divergence on demand.
Even correctly identified, the signal is probabilistic and slow. A trend can extend for a long stretch on steadily thinning volume without turning, so the honest use is as a reason to require more from a new entry rather than as a reason to fade a move that is still working.
Frequently Asked Questions
What does it mean when volume diverges from price?
Volume divergence means price keeps moving in one direction - for example, a rally making new highs - while volume trends the opposite way, such as declining on each successive push higher. Some technical analysts read this as a sign that fewer participants are actively supporting the move, since a genuinely broad-based trend is generally expected to draw in more trading activity, not less, as it continues.
Is volume divergence a reliable sell or buy signal?
No single divergence reading is a reliable standalone signal. It is a probabilistic observation about participation, not a timing tool, and a price trend can continue on shrinking volume for an extended period without any reversal. Traders who use it generally treat it as one input alongside price structure, other indicators, and risk management rather than a trigger on its own.
How is volume divergence different from a bearish or bullish price divergence with an oscillator?
Both compare price against a second data series that fails to confirm the price trend, but the second series is different. Oscillator divergence (with RSI or MACD, for example) compares price against a momentum calculation derived from price itself. Volume divergence compares price against raw traded volume, an independent measure of participation rather than a derivative of price movement.
Can volume divergence appear in both uptrends and downtrends?
Yes. In an uptrend, divergence typically shows up as declining volume on new price highs. In a downtrend, it typically shows up as declining volume on new price lows. In both cases the underlying interpretation is the same: fewer participants appear to be pushing the move as it extends, which some analysts read as a sign the trend may be losing conviction, without specifying when or whether a reversal will follow.
Should the comparison use raw volume or a smoothed series?
Raw volume is too noisy for a swing-to-swing comparison, since a single heavy session can dominate a leg. Most practitioners compare averages across each leg or use a smoothed volume line. That introduces a smoothing parameter, which means the divergence is partly a function of a setting. Stating the smoothing alongside the observation is what makes it reproducible.
Can volume divergence be measured rather than judged by eye?
Yes, by defining the two swing legs mechanically and comparing average volume across them. That converts a visual impression into a number that can be recorded and tested. It also exposes how much the result depends on where the legs were marked, which is the same swing-identification problem that affects price divergence and is usually less visible in the volume version.
Does rising volume into a decline mean the same as rising volume into an advance?
The conventional interpretations differ. Rising volume into an advance is generally described as participation supporting the move. Rising volume into a decline is described sometimes as selling pressure and sometimes as accumulation into weakness, depending on what follows. The same observation therefore supports opposite readings, which is a sign that volume alone is not settling the question.
How do passive flows distort a volume divergence read?
Index inclusion, fund rebalancing and options expiry all add volume that has nothing to do with a directional view on the security. If such an event falls inside one of the two legs being compared, that leg volume is inflated for structural reasons and the divergence is an artefact. Checking the calendar for known flow events over both legs is a quick way to rule this out.
Do the two legs need to cover the same number of bars?
For a total-volume comparison, yes, or the longer leg wins regardless. Comparing sums across legs of unequal length measures duration rather than participation. Using average volume per bar removes that problem and introduces another, since a short intense leg and a long quiet one can average to similar figures. Reporting both the average and the length keeps the comparison interpretable.
References
- CMT Association - professional body for the Chartered Market Technician (CMT) designation, covering technical analysis methodology including volume analysis.
- CMT Association: Education Resources - reference material on technical analysis concepts and terminology.