
Direct Answer
Volume is the number of shares (or contracts, for derivatives) traded during a given time period, reported alongside price data. It is commonly used to gauge the conviction or participation behind a price move, a price move on high volume is generally considered more significant than the same move on low volume, since it reflects more market participants actively transacting at that price level. In short, volume answers "how many people were involved" while price answers "what level did they trade at."
Key Takeaways
- Volume counts participation, not price. It is a count of shares or contracts traded in a period, a separate data series that sits alongside, not inside, the price itself.
- High volume generally signals more conviction behind a move. The same price change accompanied by heavier trading activity is generally read as more significant than the same change on light trading activity.
- Volume has no inherent direction. It measures how much traded, not whether the move was up or down, a heavy-volume decline and a heavy-volume rally both show high participation.
- Volume is reported for stocks, ETFs, futures, options, and (with venue-specific caveats) cryptocurrency. Derivatives volume is expressed in contracts rather than shares.
- There is no universally correct volume threshold. What counts as "high" or "low" volume is commonly assessed relative to a security's own typical trading activity, not against a fixed number.
What Is Volume?
Volume is the number of shares (or contracts, for derivatives) traded during a given time period, reported alongside price data. Every executed trade involves a buyer and a seller exchanging a specific quantity of shares at an agreed price; volume simply totals that quantity across all trades in the period being measured, a single minute, an hour, a trading day, a week, or any other interval a chart or data feed displays.
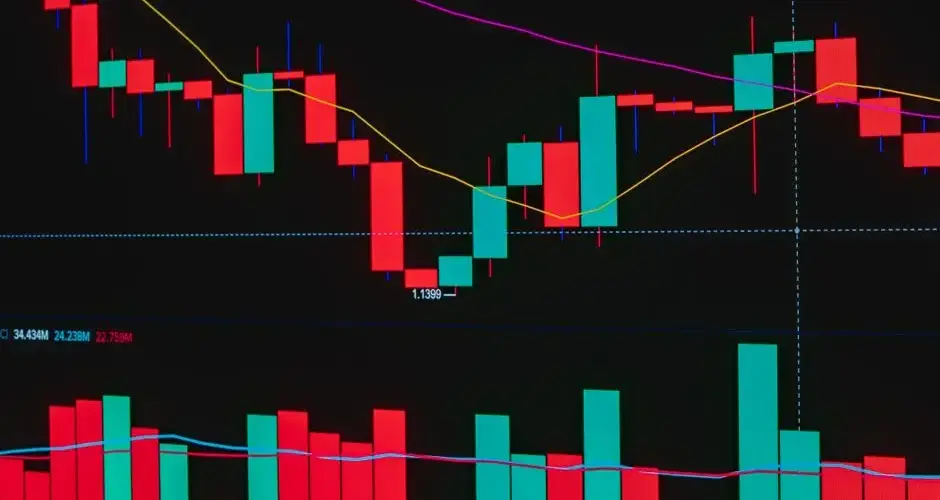
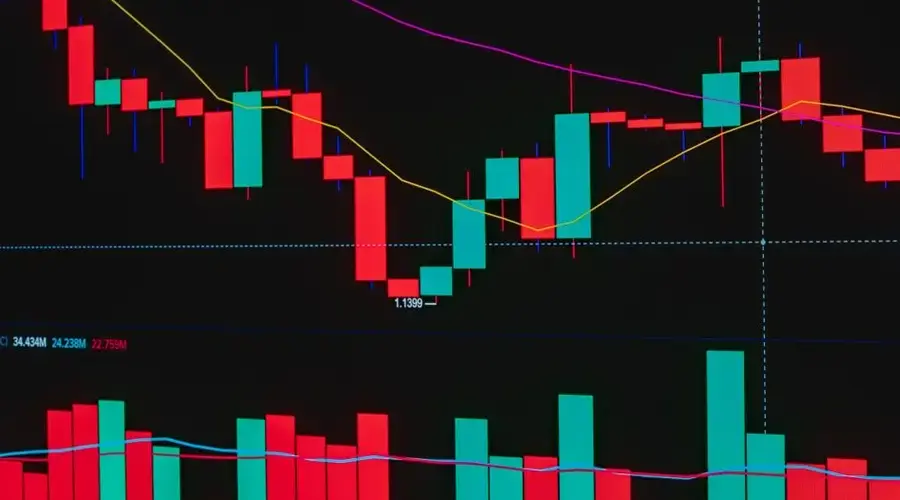
Volume is reported as a companion series to price, not a replacement for it. A stock's price chart shows the sequence of prices at which trades occurred; the volume series shown alongside it (commonly as a bar or histogram beneath the price chart) shows how much trading activity produced each part of that price path. The two data series are read together, not in isolation.
For derivatives such as options and futures, the same concept applies but the unit changes from shares to contracts, the number of options or futures contracts that changed hands during the period. The underlying idea is identical: volume is a measure of how much trading activity occurred, regardless of what is being traded.
Why Participation Matters
Volume is commonly used to gauge the conviction or participation behind a price move. A price move on high volume is generally considered more significant than the same move on low volume, since it reflects more market participants actively transacting at that price level. The reasoning is straightforward: a price change produced by many buyers and sellers actively trading reflects a broader consensus (or broader disagreement resolved through trading) than the same price change produced by a small number of trades with little activity behind them.
This is why volume is often described as confirming or failing to confirm a price move, rather than predicting one on its own. It adds context to what the price data is showing, how many participants were actually behind a given move, without independently indicating a future direction.
Hypothetical Example, For Education Only
Consider two separate trading days for the same hypothetical stock, each showing an identical 5% price increase, from $40.00 to $42.00.
- Day one: The stock trades 1,200,000 shares, compared with its typical daily volume of roughly 1,000,000 shares, activity close to normal.
- Day two (a different, later session): The stock trades 4,800,000 shares against that same roughly 1,000,000-share typical daily volume, activity several times heavier than usual.
- Reading the two days together: Both sessions show the identical 5% price gain ($40.00 to $42.00, a $2.00 move). But day two involved four times as many shares changing hands as day one (4,800,000 versus 1,200,000). Under the general principle that a price move on high volume is considered more significant than the same move on low volume, day two's rally reflects meaningfully broader participation than day one's, more market participants were actively transacting at the higher price level.
This does not tell a trader what will happen next; it only describes how much trading activity stood behind each move. Volume is a measure of participation, not a forecast.
Limitations and Common Mistakes
Treating volume as directional on its own
Volume has no inherent up or down bias. It is simply a count of shares traded. A heavy-volume session can accompany a sharp decline just as easily as a sharp rally. Volume is generally interpreted together with the direction of the price move it accompanies, not read as bullish or bearish by itself.
Comparing volume across unrelated securities
A "high" volume figure for a thinly traded small-cap stock can be a routine or even low figure for a heavily traded large-cap stock. What counts as high or low volume is commonly judged relative to a given security's own typical trading activity, not against an absolute number that applies across every security.
Ignoring that volume is only one input
Volume adds context about participation; it is not a complete analysis on its own. There is no universally correct way to combine volume with price, and different market participants weigh it differently as part of a broader read of a security's trading activity.
Overlooking data-source differences for derivatives and crypto
Options and futures volume is expressed in contracts, not shares, so it is not directly comparable to equity share volume without conversion context. Cryptocurrency volume is reported per exchange or aggregated across venues; because crypto trades across many separate exchanges rather than through one consolidated market, reported figures can differ meaningfully depending on the data source.
A Reported Number, Not a Measured One
Price and volume feel like the same kind of data and they are not. A price is what a transaction happened at. A volume figure is a total assembled from reported trades, and what gets included depends on the venue coverage of the feed, how off-exchange activity is captured and how the source treats various trade types. Two providers can publish different daily volume for the same security without either being wrong.
That matters most for instruments trading across many venues, where a single feed may capture only part of total activity. Anything built on relative volume inherits that gap directly, since the average and the current figure both come from the same partial view.
On interpretation, the two standing rules are worth restating. Volume has no direction: a heavy session accompanies declines and advances alike, so it is read alongside the price move rather than as bullish or bearish on its own. And volume is only comparable within an instrument, since a figure that is remarkable for a small-cap name is routine for a heavily traded one.
What it genuinely adds is a second, separate series sitting alongside price rather than derived from it, which is why it can contribute information no price-based calculation can reproduce.
FAQ
What is trading volume?
Trading volume is the number of shares (or contracts, for derivatives) traded during a given time period, reported alongside price data. A daily volume figure counts every share that changed hands that day; an hourly or per-bar volume figure counts shares traded within that narrower window. Volume is reported for essentially every listed security and is a standard companion data series to price on charts and quote screens.
Why does volume matter when analyzing a price move?
Volume is commonly used to gauge the conviction or participation behind a price move. A price move on high volume is generally considered more significant than the same move on low volume, since it reflects more market participants actively transacting at that price level. Two 3% rallies can look identical on a price chart alone, but the one accompanied by heavier volume reflects broader participation in that move.
Is high volume always bullish?
No. Volume measures participation, not direction. High volume can accompany a sharp decline just as easily as a sharp rally, it reflects how many shares changed hands, not whether the move was favorable. Volume is generally read alongside the direction of the price move it accompanies, not interpreted as bullish or bearish on its own.
How is volume different from price?
Price reflects the level at which the most recent trade occurred; volume reflects how much trading activity produced that price. They are reported as separate but complementary data series, price charts commonly show a volume histogram along the bottom of the same time axis, so a trader can see participation levels at each point along the price path.
Where can I see a stock's volume data?
Volume is reported by exchanges and consolidated market-data feeds alongside price for essentially every listed stock, ETF, and futures or options contract. Brokerage platforms, charting tools, and financial data sites typically display current-day volume next to the quote and show historical volume as a bar beneath the price chart for any selected time period.
Does volume apply to cryptocurrency and options too?
Yes, with a caveat. Options and futures volume counts contracts traded rather than shares, following the same underlying idea of participation. Cryptocurrency volume is reported per exchange or as an aggregated figure across venues, but because crypto trades across many separate exchanges rather than through a single consolidated tape, reported volume figures can vary meaningfully by data source.
Does volume count both sides of a trade?
One. A transaction of 100 shares adds 100 to the volume figure, not 200, even though a buyer and a seller were both involved. This is worth stating because the phrasing around volume often implies otherwise, and because it is the reason volume cannot indicate buying or selling pressure on its own: every share bought was also a share sold.
What is the difference between volume and open interest?
Volume counts contracts or shares traded during a period and resets each period. Open interest counts positions currently outstanding and only changes when a position is opened or closed, so it persists between sessions. Open interest applies to derivatives and has no equivalent for cash equities. High volume with flat open interest describes positions changing hands rather than new exposure being created.
Why is cryptocurrency volume harder to rely on?
There is no consolidated tape, so the figure comes from individual venues reporting their own activity, with no central verification. Coverage differs between data aggregators, the same asset trades across many venues with different reporting practices, and concerns about inflated reported activity on some venues are longstanding. The number is still useful for comparing an asset with its own recent history on the same venue, which is a narrower claim than it looks.
References
Disclaimer
This article is for educational and informational purposes only and does not constitute personalized investment, financial, or legal advice. Volume figures and their interpretation vary by security, market, and data source. Always verify current data from primary sources. Trading involves risk, including the possible loss of principal.