
Direct Answer
A golden cross screen filters for securities where a shorter-term moving average, commonly the 50-day, has recently crossed above a longer-term moving average, commonly the 200-day. Some technical analysts associate this crossover with a shift toward a longer-term uptrend. Because both averages are built from past prices, the crossover is lagging by construction - it confirms a trend change that has already been underway rather than predicting one in advance.
Key Takeaways
- A golden cross screen looks for the shorter-term moving average (commonly 50-day) crossing above the longer-term moving average (commonly 200-day).
- The signal is lagging: both averages are computed from prices that have already happened, so the crossover shows up after the underlying trend shift has been in motion.
- A golden cross confirms momentum that already exists - it doesn't forecast a new uptrend starting from the crossover date.
- The opposite pattern, a death cross, is the shorter-term average crossing below the longer-term average.
- Screens can vary the moving-average pair (e.g., 20/100) and the moving-average type (simple vs. exponential), which changes sensitivity and lag.
- A crossover alone says nothing about volume, valuation, or the reason price has been rising - it's a single, mechanical filter criterion.
- Whipsaws - a cross followed quickly by a reversal - are common in flat or choppy markets where the two averages sit close together.
What Does a Golden Cross Screen Look For?
A golden cross screen is a technical screening filter, not an indicator you plot on a single chart - it runs across a universe of securities and returns the ones matching a specific moving-average condition. The classic definition compares two simple moving averages of closing price: a shorter lookback window, most commonly 50 trading days, and a longer lookback window, most commonly 200 trading days. When the 50-day average moves from below the 200-day average to above it, that crossing point is the golden cross, and a screen built around it surfaces every security where that crossover happened recently.
The word "recently" matters and is set by whoever builds the screen - some screens flag any crossover within the last few sessions, others widen the window. Either way, the screen is answering one narrow question across many tickers at once: which securities just had their shorter-term average overtake their longer-term average, out of a much larger list that either hasn't crossed or crossed a while ago.
Why the Crossover Is a Lagging Signal
A moving average is, by definition, a backward-looking average of past closing prices - a 50-day simple moving average today is the mean close over the last 50 sessions, and a 200-day average is the mean over the last 200. Neither average uses any information about tomorrow's price. For the 50-day average to climb high enough to cross above the 200-day average, price generally needs to have been rising, on net, for some stretch of time already - the crossover is the mathematical consequence of that prior move, not an early warning of it.

This is the core limitation to hold onto: a golden cross confirms that a trend shift has already been underway. It is not a leading indicator that predicts an uptrend is about to start from the crossover date forward. By the time a security shows up on a golden cross screen, a meaningful part of any preceding rally has typically already happened, and whatever comes next - continuation, stall, or reversal - is a separate, unresolved question the crossover itself does not answer.
An Illustrative Scenario
Picture two hypothetical stocks flagged by the same golden cross screen on the same day. Stock A spent the prior several months grinding higher on a steady uptrend, and its 50-day average finally caught up to and crossed the 200-day average - the screen is confirming a trend that's been visible on the chart for a while. Stock B, by contrast, had a sharp single-week rally off a prior downtrend that was just enough to nudge its 50-day average above its 200-day average, even though the longer-term average is still declining and the two lines are barely apart.
Both would appear as identical hits on a bare golden cross screen, but they describe very different underlying price histories. This is why a golden cross hit is typically treated as a starting point for further look - checking the slope of the longer-term average, how far apart the two averages are, and what price has done since the cross - rather than a standalone buy signal.
Limitations and Common Mistakes
- Treating the cross as predictive. The crossover reflects price action that already happened; it does not forecast what price does after the cross.
- Ignoring whipsaws. In a flat or choppy market, the 50-day and 200-day averages can sit close together and cross back and forth repeatedly without any sustained trend forming.
- Screening on the cross alone. A bare crossover says nothing about the slope of the longer-term average, volume, or valuation - context that changes how much weight the signal deserves.
- Assuming a fixed 50/200 pair is the only valid version. Screens can and do use other pairs (20/100, for instance) or exponential rather than simple averages, changing how sensitive and how lagged the screen is.
- Not checking recency. A crossover from months ago is a different situation than one from this week; a well-built screen should define and disclose its recency window.
A Cross Without a Slope Tells You Little
The bare fact of a shorter average crossing above a longer one leaves out the detail that changes its meaning: what the longer average is doing. A 50-day crossing above a rising 200-day describes an established uptrend gaining a shorter-term confirmation. The same cross above a still-falling 200-day describes a bounce inside a downtrend, and the screen reports both as a golden cross. Adding the slope of the longer average as a second condition removes a large share of the least useful hits.
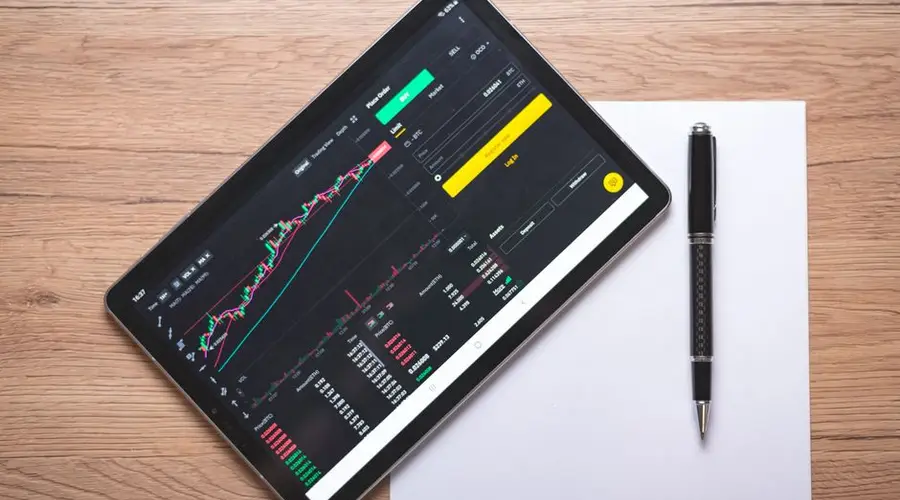
The lag is structural. Both averages summarise prices that have already happened, so by the time they intersect the trend shift responsible has been underway for some time. The cross confirms; it does not forecast a new uptrend beginning on that date.
Whipsaw is the other predictable failure. In a flat market the two averages sit close together and can cross repeatedly, generating a stream of signals with nothing behind them. The distance between the averages is a cheap filter for this and is rarely part of a default screen.
Also treat the 50 and 200 pairing as one option rather than the definition. Screens run other combinations, and each produces different crossover dates from the same price history, which means comparing signals across two screens using different pairs is comparing two different measurements.
Frequently Asked Questions
What is a golden cross screen?
A golden cross screen is a filter that surfaces securities where a shorter-term moving average, commonly the 50-day, has recently crossed above a longer-term moving average, commonly the 200-day. It's used to find names where technical analysts see a shift toward a longer-term uptrend, though the crossover confirms a trend already underway rather than predicting one.
Why is a golden cross considered a lagging signal?
Both moving averages are built from past closing prices, so the crossover can only occur after price has already been rising for some time. By the point the 50-day average crosses above the 200-day, a meaningful portion of the underlying uptrend has typically already happened, which is why the signal is described as confirming a trend rather than forecasting one.
Does every golden cross lead to a sustained uptrend?
No. A moving average crossover is a mechanical description of two averages meeting, not a guarantee about future price behavior. Price can cross, stall, and reverse shortly after, sometimes called a whipsaw, especially in choppy or range-bound conditions where the 50-day and 200-day averages sit close together.
What's the opposite of a golden cross?
The opposite is a death cross, where the shorter-term moving average crosses below the longer-term moving average. Some technical analysts associate it with a shift toward a longer-term downtrend, and like the golden cross. It is a lagging confirmation rather than a leading indicator.
Does the golden cross use simple or exponential moving averages?
The classic definition uses simple moving averages, and that is what most published commentary assumes. An exponential version responds faster, so it crosses on different dates, sometimes weeks apart. Neither is more correct, and a screen that does not state which it uses cannot be compared against historical references. The difference matters most in the ambiguous cases near a crossing.
Does the screen return more names in some market conditions?
Substantially more after a broad recovery, when many securities cross within a short window because the same market-wide advance is pulling their fast averages through their slow ones. The count is therefore a breadth reading in its own right. A screen returning a long list is telling you about the market as much as about any individual name on it.
Can a golden cross occur while price is below both averages?
Yes, and it is a case worth understanding. The cross is a relationship between the two averages, not between price and either of them. If a rally lifted the fast average above the slow one and price then fell back, the crossing can complete while price sits below both. The condition is satisfied and the situation it usually implies is not, which is why some screens add a price condition.
How does the history requirement affect which securities can appear?
A 200-day average needs 200 trading sessions, so anything listed within roughly the last ten months cannot produce the signal at all. Newly listed securities are therefore absent from the screen regardless of what their prices have done. In a period with many new listings, the screen is silently covering a smaller universe than the one it was pointed at.
What is the difference between screening on the cross and screening on the state?
An event screen tests whether the crossing happened on this bar, and returns a short list on most days. A state screen tests whether the fast average is currently above the slow one, and returns a large fraction of the universe in a rising market. They are frequently confused because both are described as golden cross screens, and their outputs have almost nothing in common.
References
- CMT Association - Technical Analysis Body of Knowledge and research on trend-following indicators.
- CFA Institute Research and Policy Center - investment research covering technical and quantitative screening methods.
Disclaimer
This page is for educational purposes only and does not constitute investment advice or a recommendation to buy or sell any security. A golden cross screen is one mechanical filter among many; it does not guarantee any future price outcome and should not be used as a standalone trading signal. Consult a qualified professional before making investment decisions.