
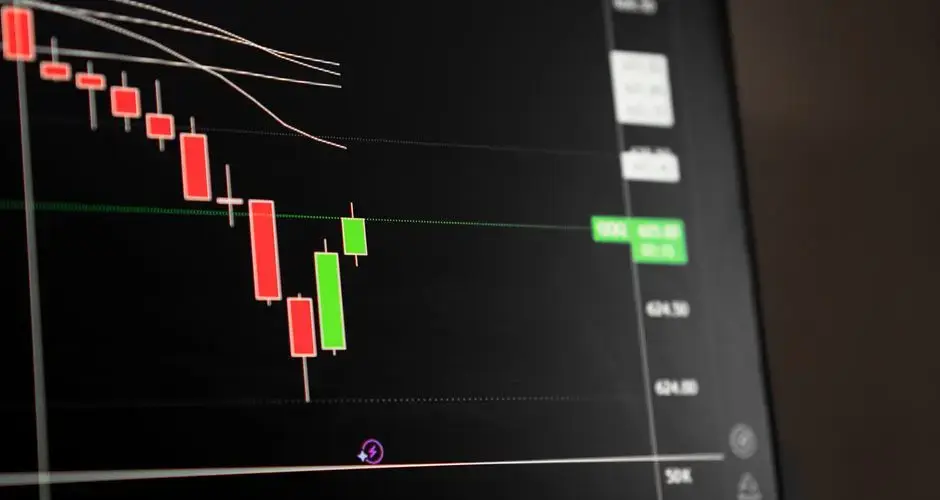
Direct Answer
A gap is the difference between where a security closed in its prior session and where it opens in the next one. Because exchanges aren't continuously matching orders overnight (for stocks) or across a session break, price can jump from one level to another without trading through the space in between.
Key Takeaways
- A gap-down screen filters for securities whose opening price today is notably below the prior session's closing price, the inverse of a gap-up screen.
- There's no fixed industry threshold; screens commonly use a minimum gap of roughly 2%, 10%, chosen based on how narrow or broad a result list a trader wants.
- Volume context matters as much as the gap itself, a gap on thin volume is more likely to be noise or a quick reversal than one accompanied by heavy relative volume.
- Gap-fill behavior (whether price retraces back to the prior close) is a common follow-up check, but it isn't guaranteed, and gaps caused by material news often don't fill quickly, if at all.
- The same raw screen output can reflect very different underlying causes, an earnings miss, a downgrade, sector-wide weakness, or an ex-dividend date, so checking the news is a standard next step, not optional.
Gap-Down Screen: Finding Overnight Losers
A gap-down screen filters for securities that opened today's trading session at a price notably lower than the prior session's close, the inverse of a gap-up. Like gap-ups, gap-downs are commonly screened alongside volume and gap-fill behavior to assess whether the negative move is likely driven by lasting news or is more likely to be retraced.
What Is a Gap-Down Screen?
A gap is the difference between where a security closed in its prior session and where it opens in the next one. Because exchanges aren't continuously matching orders overnight (for stocks) or across a session break, price can jump from one level to another without trading through the space in between. A gap-down screen isolates the subset of that universe where the open landed meaningfully below the prior close.
Mechanically, the screen computes a gap percentage for each security, (today's open − prior close) ÷ prior close, and returns everything below a chosen negative threshold, sorted by gap size, volume, or both. The screen itself doesn't explain why a name gapped down; it only identifies that it did, which is why gap screens are typically a starting point for further research rather than a standalone signal.
Setting the Gap Threshold
There's no universal cutoff for what counts as a "notable" gap down. A trader scanning for large-cap earnings reactions might set the threshold at 3%, 5%, since bigger, more liquid names rarely move that much overnight without a real catalyst. A trader scanning small caps or lower-priced stocks might set it much higher, since those names gap on smaller dollar moves as a matter of course.
A lower threshold returns a longer, noisier list that includes routine overnight drift; a higher threshold narrows the list to the sharpest overnight losers but risks missing smaller, still-relevant moves. Most screening tools let the threshold be adjusted per session rather than fixed permanently, since typical gap sizes shift with overall market volatility.
Pairing the Screen With Volume and Gap Fill
Volume as a filter
A gap-down on ordinary or below-average volume can reflect a single lopsided print, a large sell order filled at the open, rather than broad, sustained selling pressure. Filtering the gap-down list for above-average relative volume helps separate names where real supply-demand imbalance is driving the move from names where the gap is more likely a temporary quote artifact.
Gap-fill behavior
A "gap fill" happens when price later retraces back to the prior session's close, effectively closing the gap. Traders track gap-fill statistics because they inform expectations, some gap types (particularly smaller, low-conviction gaps) fill more often than others, but a gap fill is a tendency, not a rule. Gaps driven by durable news, like a materially worse earnings outlook, can persist for a long time or never fill at all.
Checking the cause
Because the screen output alone doesn't distinguish causes, the standard next step is checking the news: an earnings report, guidance cut, analyst downgrade, litigation headline, sector-wide selloff, or a routine ex-dividend date for a high-yield name can all produce a gap down that looks identical on the screen but calls for a very different response.
Illustrative Scenario
Consider a mid-cap industrial stock that closed the prior session at $48.00. Overnight, it reports quarterly revenue below analyst estimates and cuts full-year guidance. The stock opens the next session at $43.20, a gap of roughly −10%. A gap-down screen set to a −5% threshold would surface this name near the top of its results, especially once sorted by relative volume, since the opening print is accompanied by several multiples of the stock's typical morning volume.
A trader reviewing the screen sees the gap, checks the news, and confirms the cause is the guidance cut rather than a data error or a thin-volume anomaly. From there. The trader treats the gap as a research flag rather than an automatic trade signal, watching whether the stock holds below the opening print through the first half hour, or instead starts drifting back toward $48.00, which would be an early sign of a gap fill. This is illustrative only, not a recommendation or a prediction of how any real security will behave.
Limitations of a Gap-Down Screen
A gap-down screen is purely descriptive, it reports that a gap occurred and how large it was, without weighing the underlying cause. It can be triggered by data issues (a bad print, a stale prior close after a corporate action) as easily as by genuine news, so results need verification before being acted on. It also says nothing about what happens after the open; a large gap can extend, reverse, or simply trade sideways for the rest of the session. Like any single-condition screen, it works best as one filter among several, combined with volume, sector context, and a check of the actual news, not as a complete trading system on its own.

Some Gaps Are Data, Not Price
Before interpreting anything a gap-down screen returns, rule out the boring explanation. A bad print, a stale prior close that was never adjusted after a corporate action, or a split recorded on one side of the comparison and not the other will all produce a large, entirely fictional gap. The screen has no way to distinguish those from a genuine overnight repricing, and they tend to sit at the top of the list precisely because they are large.
Once the gap is real, the size threshold you chose is doing a lot of work. There is no industry standard, and a two percent cutoff and a ten percent cutoff produce different lists describing different phenomena. Pick the threshold for the kind of event you are looking for rather than for the length of list it happens to return.
Volume is the context that separates a meaningful gap from a thin-market artefact. A large percentage move opening on light trade can reverse within the hour; the same move on heavy relative volume reflects broad repricing. Gap-fill behaviour, whether price retraces to the prior close, is a second common follow-up, and it is a tendency rather than a rule, especially where real news caused the gap.
The screen is purely descriptive. It reports that a gap occurred and how big it was, never why, and the session that follows can extend the move, reverse it or do very little.
Gap-Down Screen FAQs
What counts as a gap down?
There's no universal threshold. Many gap-down screens use a minimum percentage move, commonly somewhere between 2% and 10% below the prior session's close, but the exact cutoff depends on what a trader is trying to find, a lower threshold surfaces more names, a higher one narrows the list to the sharpest overnight losers.
Why pair a gap-down screen with volume?
A gap on thin volume can be a single lopsided print rather than broad participation, and it's more prone to a quick reversal. A gap-down screen filtered for above-average relative volume is more likely to reflect a real shift in supply and demand rather than a temporary quote anomaly.
Does a gap down always get filled?
No. Gap fills, price retracing back to the prior close, happen often enough that traders track the statistic, but plenty of gaps caused by material news never fill, or fill only much later. Whether a gap fills depends heavily on what caused it.
What's the difference between a gap-down screen and a gap-up screen?
They use the same mechanics, comparing today's open to the prior close, but filter in opposite directions. A gap-up screen looks for securities opening notably above the prior close; a gap-down screen looks for securities opening notably below it.
What causes a stock to gap down?
Common causes include earnings misses or weak guidance, negative news released after the prior close, analyst downgrades, broad market or sector weakness, and dividend ex-dates for high-yield names. The same screen result can have very different causes, which is why checking the news is a standard next step.
Should the gap threshold be scaled to each security volatility?
A fixed percentage threshold flags high-volatility names constantly and rarely catches anything in a quiet one, so the list is largely a ranking by volatility. Expressing the threshold as a multiple of average true range normalises it, so a gap counts as unusual relative to that security own behaviour. The resulting list is smaller and more evenly distributed across the universe.
Can a gap-down screen be run before the open?
Pre-market prices give an indication rather than a gap. The gap is defined against the official opening print, and pre-market trading is thin enough that the indicated level frequently differs from where the security actually opens. A pre-market scan is useful for preparation and produces a list that will not match the one computed after the open.
What is the difference between a full gap and a partial gap?
A full gap down opens below the entire previous session range, so there is a price band with no trading on either side of the boundary. A partial gap opens below the previous close but still inside the previous day range, so the two sessions overlap. The full version is the stronger condition and is much rarer, and screens that do not distinguish them return mostly partial gaps.
How do trading halts appear on a gap-down screen?
A security halted during the session and reopened substantially lower creates a price discontinuity that is not an overnight gap. Whether the screen sees it depends on the data convention: a scan comparing the open against the prior close misses it entirely, while one looking for intraday discontinuities catches it. Halts are also a case where the cause is almost always specific and worth checking directly.