

Direct Answer
Support and resistance levels can appear, disappear, or shift in apparent significance depending on which chart timeframe is used. A minor intraday level may be invisible on a weekly chart, while a major weekly level may not stand out on an intraday chart alone. Checking a level across multiple timeframes is one way analysts assess whether it's likely to carry broader significance.
Key Takeaways
- A support or resistance level is tied to a price, not a single chart, but how prominent it looks depends on the timeframe you're viewing.
- Intraday charts (1-minute, 5-minute, hourly) surface short-lived levels that may never register on a daily or weekly chart.
- Daily and weekly charts compress months or years of price history, so only levels tested repeatedly over long stretches tend to stand out.
- A level visible on several timeframes at once is generally treated by analysts as more significant than one visible on only one chart.
- Multi-timeframe confirmation is a way to gauge significance, not a rule that a level must appear everywhere to matter.
- The same price level is support when price sits above it and resistance when price sits below it, regardless of which timeframe you're looking at.
- Zooming out before zooming in is a common workflow: identify the higher-timeframe context first, then look for confluence on lower timeframes.
Why the Same Level Looks Different on Different Charts
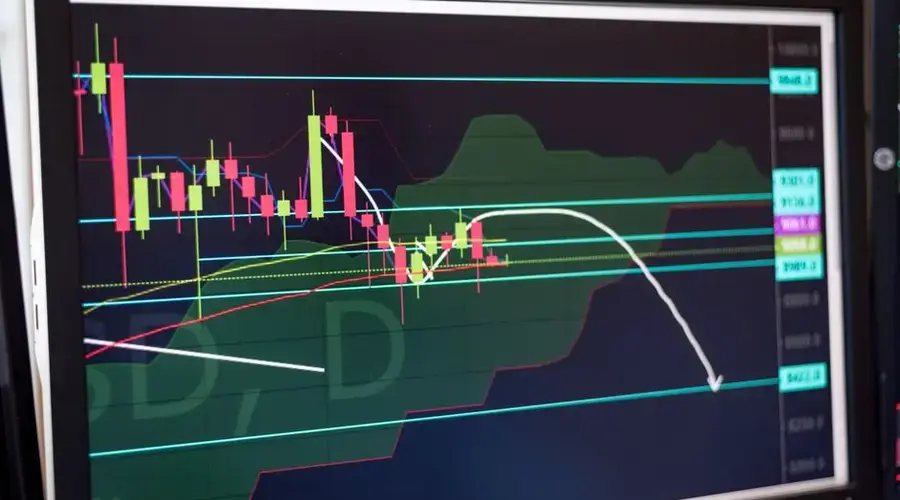
A chart is a compressed summary of price history. A 5-minute chart shows perhaps a day or two of trading in detail, while a weekly chart compresses years into a single view where each candle represents five trading days. A price swing that produced a sharp reversal over a few hours will show up clearly on the 5-minute chart, but on the weekly chart that same swing might be a single small wick lost among far larger moves. The level isn't gone, it's just too small relative to everything else on the weekly chart to draw attention.
The reverse is also true. A level that formed years ago and has been tested repeatedly on the weekly chart carries a kind of memory that an intraday trader, looking only at the last few sessions, has no way to see directly. That trader might watch price approach the level and react without knowing a longer-term structural reason exists for the reaction.
How Analysts Check a Level Across Timeframes
A common workflow starts on a higher timeframe, weekly or daily, to identify the broader structural levels for an instrument. From there, the analyst steps down to shorter timeframes (4-hour, hourly, or intraday) to see whether price has reacted at or near that same price on smaller charts too. A level that shows repeated reactions across several timeframes, reversals, pauses, or increased volume, is generally treated as carrying more weight than a level that only appears on one chart in isolation.
For example, imagine a price has repeatedly stalled near a particular level on the weekly chart over several years. An analyst switching to the daily or hourly chart of the same instrument might notice that recent price action also hesitates near that same level, even though nothing on the short-term chart alone would explain why. The higher-timeframe context gives the short-term reaction a plausible explanation, and the alignment across timeframes is what analysts point to when arguing the level deserves more attention.
Limitations and Common Mistakes
- Treating every level as universal. A level meaningful to a day trader on a 5-minute chart may have no relevance to a position trader working off the weekly chart, and vice versa, significance is often audience-specific.
- Assuming confirmation guarantees a reaction. A level appearing on multiple timeframes raises the odds analysts assign to it mattering, but it does not guarantee price will actually reverse or pause there.
- Ignoring timeframe when drawing lines. Levels drawn from a low-timeframe chart and layered onto a higher-timeframe chart (or vice versa) without adjustment can be misleading, always confirm what timeframe a level was originally identified on.
- Overcrowding a chart. Marking every level from every timeframe onto one chart can make it harder, not easier, to see which levels actually matter.
- Forgetting levels are approximate zones. Support and resistance are rarely a single exact price; treating them as a zone rather than a precise line tends to match how price actually behaves near them.
The Level Belongs to the Price, Not the Chart
A support or resistance level exists at a price. The chart interval only decides how visible it is. A level formed over three intraday sessions is genuinely there and simply too small to register once months of history are compressed into weekly bars, and a level tested repeatedly over years is genuinely there and easy to miss on a five-minute chart that covers a single afternoon.
Which means significance is partly a question of audience. A level that matters enormously to a day trader can be irrelevant to someone working from the weekly chart, and neither of them is wrong about it. Before treating a level as major, ask major to whom, and on what holding period.
The practical hazard is chart clutter. Marking every level from every interval onto one chart produces a screen where price is always near something, and a level that is always nearby has stopped being information. Keep the levels from the timeframes you actually trade, and check the others when you need context rather than leaving them drawn.
Also record which chart a level came from. Lines drawn on an intraday chart and later layered onto a daily one, or the reverse, quietly change meaning in transit, and a level whose origin you cannot remember is one you cannot evaluate when price arrives at it.
FAQ
Why does a support or resistance level look different on different timeframes?
Each timeframe's chart is built from price action over a different window, so a level that stands out on an intraday chart (formed over hours) may be too minor to register on a weekly chart (formed over years), and vice versa. The level itself is the same price, but its visual prominence depends on how much history the chart is compressing into view.
How do analysts check a level across multiple timeframes?
A common approach is to identify a level on one chart, then step through higher and lower timeframes of the same instrument to see whether price reacted at or near that same level repeatedly. A level that shows up across several timeframes is generally treated as more significant than one visible on only a single chart.
Does a level need to appear on every timeframe to matter?
No. A level can be meaningful on a single timeframe for a trader operating on that horizon even if it is invisible elsewhere. Multi-timeframe confirmation is one input analysts use to gauge broader significance, not a requirement for a level to have any relevance at all.
Can a level be support on one timeframe and resistance on another?
The classification of a level as support or resistance depends on where price is trading relative to it, not the timeframe. If price is above the level it typically acts as support, and if price is below it typically acts as resistance, regardless of which chart is used to view it.
Does a level from a higher timeframe deserve more weight?
That is the common convention, and the argument behind it is that a level formed over more sessions represents more accumulated trading at that price. It is an argument rather than a measurement, and it has an obvious counter: a level formed years ago may involve participants who are no longer present. Weighting by timeframe is a reasonable default that should be recognised as an assumption.
How wide should a level be treated as a zone on each timeframe?
The width should scale with the typical range of the timeframe it came from, since a weekly level is defined by bars that move much further than five-minute bars. Applying a fixed width across all timeframes makes higher-timeframe levels unrealistically precise and lower-timeframe levels unusably wide. Expressing the zone as a fraction of that timeframe average range keeps it proportionate.
What if the same level sits at slightly different prices on two timeframes?
That is expected rather than a problem to resolve. Aggregation determines which bar supplies the extreme, so a weekly high and the daily high inside that week can differ by a small amount depending on how the bars were built and which session data was included. The practical response is to treat the cluster as a single zone bounded by the widest of the candidates.
Do intraday levels persist into the next session?
Some do and most do not. Session extremes, the prior close and the opening range boundaries are referenced by enough participants that they retain some standing overnight. Minor intraday structure formed inside a quiet hour generally does not, because it reflected a temporary balance rather than a level anybody recorded. Carrying every intraday level forward produces a chart too crowded to read.
Should the same level-drawing rule be used on every timeframe?
Keeping the rule constant is what makes agreement across timeframes informative. If levels are drawn from swing highs on one chart and from consolidation edges on another, a level appearing on both may just reflect the two methods happening to point at the same price. Varying only the aggregation and holding the method fixed is the same discipline that applies to indicator settings.
References
Disclaimer
This content is for educational purposes only and does not constitute investment, financial, or trading advice. Technical analysis concepts like support and resistance reflect historical price behavior and are not guarantees of future performance. Swoopr Investment is not a licensed investment advisor; consult a qualified professional before making financial decisions.