
Direct Answer
Volume-based support and resistance identifies price levels using historical trading volume rather than price action alone, most commonly through a volume profile that shows how much volume traded at each price level over a period. Levels where heavy trading occurred - high-volume nodes - are commonly treated as stronger support or resistance than levels with little historical volume, on the reasoning that more market participants have a cost basis or interest at those prices.
Key Takeaways
- A volume profile plots historical volume by price level rather than by time, turning a normal time-based volume chart sideways.
- High-volume nodes (HVNs) are price levels with heavy historical trading and are commonly treated as stronger support/resistance candidates.
- Low-volume nodes (LVNs) are price levels the market traded through quickly, with comparatively little volume left behind.
- The reasoning behind volume-based levels is participant cost basis and interest, not just where price momentarily touched.
- Volume-based levels are typically used alongside price-based support and resistance, not as a standalone replacement for it.
- A volume profile reflects a specific historical window and its levels can shift as new trading activity accumulates.
What Is a Volume Profile?
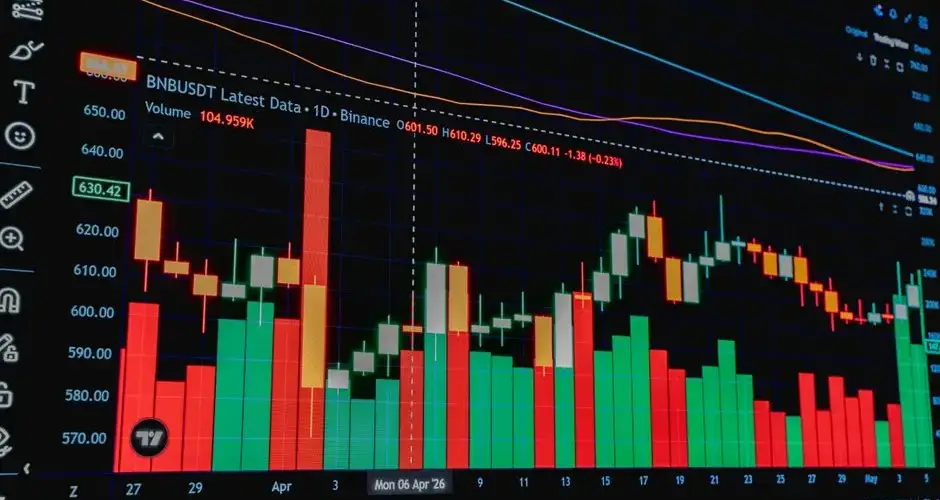
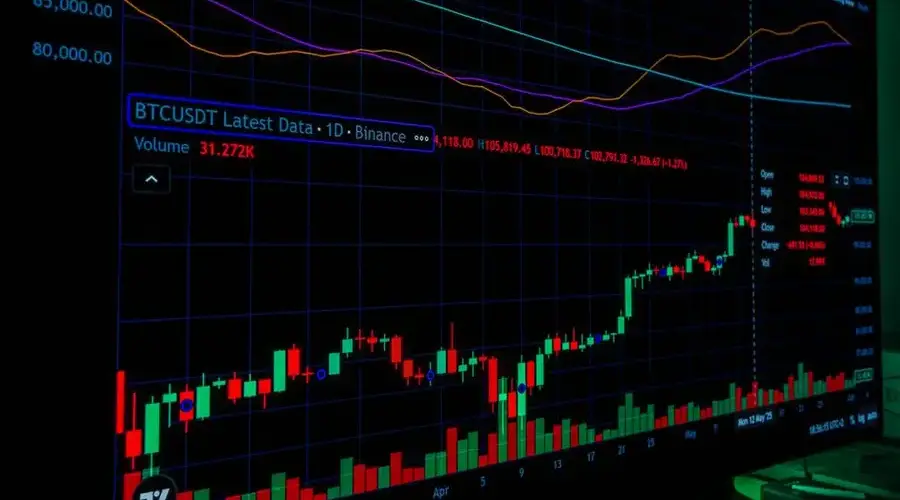
A standard volume chart shows total volume traded during each time period - each bar represents one day, one hour, or whatever the chart's timeframe is. A volume profile reorganizes the same underlying data differently: instead of grouping volume by time, it groups volume by price. The result is typically displayed as a horizontal histogram running alongside the price axis, where each horizontal bar shows the total volume that traded at (or within a small band around) that specific price level over the chosen period.
Because a volume profile is built from the same price-and-volume data every chart already has, it doesn't require any additional data source - it's a different way of organizing information that's already available. The period the profile covers can be a fixed date range, a rolling lookback window, or a session, depending on the charting platform and the trader's preference.
High-Volume Nodes vs. Low-Volume Nodes
Once volume is organized by price, two kinds of price levels stand out. A high-volume node (HVN) is a price level where a large amount of trading occurred over the profile's period - a price the market spent a lot of time and activity at. A low-volume node (LVN) is the opposite: a price level with comparatively little volume, often because price moved through it quickly rather than lingering there.
The common interpretation is that high-volume nodes are stronger candidates for future support or resistance than low-volume nodes. The reasoning: if a large amount of volume traded at a given price, a large number of participants have a cost basis or an interest at that level - some bought there and may defend it as support if price returns, others may have sold there and treat it as resistance on a retest. A low-volume node, by contrast, represents a price relatively few participants have a stake in, so there's less reason to expect buying or selling pressure to concentrate there if price revisits it.
Illustrative scenario: suppose a stock spent several weeks consolidating in a tight range before breaking higher. A volume profile built over that consolidation period would likely show a thick high-volume node clustered around the range's midpoint, where most of the back-and-forth trading occurred, and thinner low-volume nodes near the range's edges, where price only briefly extended before reversing. If the stock later pulls back toward that old range, the high-volume node - not the range's exact high or low - is the level volume-based analysis would flag as the more significant support to watch, because that's where the concentration of historical activity actually sat.
Why Volume-Based Levels Are Used Alongside Price-Based Levels
Traditional support and resistance is drawn from price structure alone - prior swing highs and lows, trendlines, round numbers. That approach treats every touch of a level as roughly equally meaningful, regardless of how much trading actually happened there. Volume-based analysis adds information price structure doesn't capture on its own: two price levels can look identical on a plain price chart, yet one might have a thick high-volume node behind it and the other almost none.
In practice, many technical analysts look for agreement between the two approaches - a price-based swing level that also lines up with a high-volume node is often treated as carrying more weight than either signal alone. Volume-based analysis is generally used as a complement to price-action-based support and resistance, not a wholesale replacement for it.
Limitations and Common Mistakes
- Treating a high-volume node as a guarantee. A level with heavy historical volume is a candidate for support or resistance, not a certainty - price can and does break through high-volume nodes, especially on new information that changes why participants are trading.
- Ignoring the lookback period. A volume profile only reflects the window it was calculated over. A node that looks significant on a one-month profile may look very different on a one-year profile, and neither window is inherently the "correct" one - the choice should match the trader's timeframe.
- Assuming volume data is uniformly reliable across venues and assets. Volume reported for a given security can vary by data source, and for assets that trade across multiple venues or exchanges, a profile built from a single feed may not reflect total market-wide volume.
- Using volume-based levels in isolation. Because the reasoning behind high-volume nodes (participant cost basis) is inferential, not observed directly, volume-based levels are generally more useful combined with price structure, trend context, and risk management than relied on alone.
- Confusing volume profile with simple volume bars. A time-based volume bar chart (volume per day/hour) answers "how much traded on this date"; a volume profile answers "how much traded at this price" - they're built from the same data but answer different questions.
A Profile Is Only as Good as Its Window
The first question to ask about any volume profile is what period built it. The nodes are not properties of the instrument; they are a summary of trading inside one chosen window, and a level that looks like a dominant high-volume node on a one-month profile can disappear entirely on a one-year one. Neither window is correct in the abstract. The right one is the one that matches how long you intend to be in the trade.
The second question is where the volume data came from. For an instrument that trades across multiple venues, a profile built from a single feed reflects that feed rather than the market, and the shape of the histogram can shift with the source. That is not a reason to distrust the tool, but it is a reason to know which data you are looking at before treating a node as a fact about participation.
What the profile genuinely adds is the distinction price structure misses. Two prior highs can look identical on a price chart while one was reached in a few minutes and the other absorbed weeks of two-sided trading. Volume by price separates those, and that separation is the reason to bother with the tool at all.
A heavy node remains a candidate, not a guarantee. Price breaks through high-volume areas regularly, particularly when new information changes why participants are trading at all, and the accumulated cost basis that made the node significant becomes the reason a lot of people want out at once.
Frequently Asked Questions
What is a volume profile?
A volume profile is a chart display that shows how much trading volume occurred at each price level over a chosen period, plotted horizontally alongside the price axis rather than over time. It turns a normal time-based volume bar chart into a picture of where volume concentrated by price instead of by date.
What is the difference between a high-volume node and a low-volume node?
A high-volume node (HVN) is a price level where a large amount of historical volume traded, commonly treated as a stronger candidate for support or resistance because more participants have a cost basis or interest there. A low-volume node (LVN) is a price level where comparatively little volume traded, often associated with prices that moved through quickly rather than levels the market spent much time defending.
Is volume-based support and resistance more reliable than price-based levels?
Not inherently. Volume-based levels add a second, independent data source to price-based levels, and traders often look for agreement between the two as added confidence. Neither approach guarantees a level holds, and both can fail, especially around news or other events that shift the reasons participants were trading at a given price.
Do I need special software to see a volume profile?
Most retail and professional charting platforms include a volume profile tool, often as an overlay or a separate indicator that can be applied to any timeframe or a fixed date range. The underlying data is simply historical volume at each traded price, so the calculation itself does not require anything beyond that price and volume history.
Can volume-based levels change over time?
Yes. A volume profile reflects a specific historical window, so the high-volume and low-volume price levels it shows will shift as new trading activity occurs and as older data rolls out of the chosen lookback period. A level that was a high-volume node last quarter is not guaranteed to remain one going forward.
Does a volume profile require tick data to be accurate?
An exact profile does, since it needs to know the volume that traded at each price. Many platforms approximate instead, distributing each bar volume across its price range according to a rule, often evenly. That approximation can misplace the point of control substantially on bars with wide ranges. Whether the profile on your chart is measured or estimated is worth establishing before treating a node as a precise level.
What is the difference between a session profile and a fixed-range profile?
A session profile is rebuilt for each trading day and describes where that session volume concentrated. A fixed-range profile covers a span the analyst selects, such as a consolidation or a move between two swings, and describes that structure instead. The nodes they produce can be quite different, since the first is bounded by the calendar and the second by a judgement about what stretch is relevant.
Does a high-volume node act as support or as resistance?
Either, depending on where price currently sits relative to it. The node marks a price where a lot of trading occurred, which is usually interpreted as a price many participants found acceptable. Approached from above it is discussed as support and from below as resistance, which is the same observation described two ways. The node itself carries no directional information.
Do volume nodes from months ago still matter?
The honest answer is that it depends on whether the participants who created them are still there, which the chart cannot tell you. The argument for a node rests on positions taken at that price, and positions get closed, hedged and transferred over time. Recent nodes rest on a stronger version of that argument than old ones. Nothing measures the decay, so this is a reason for caution rather than a rule.