
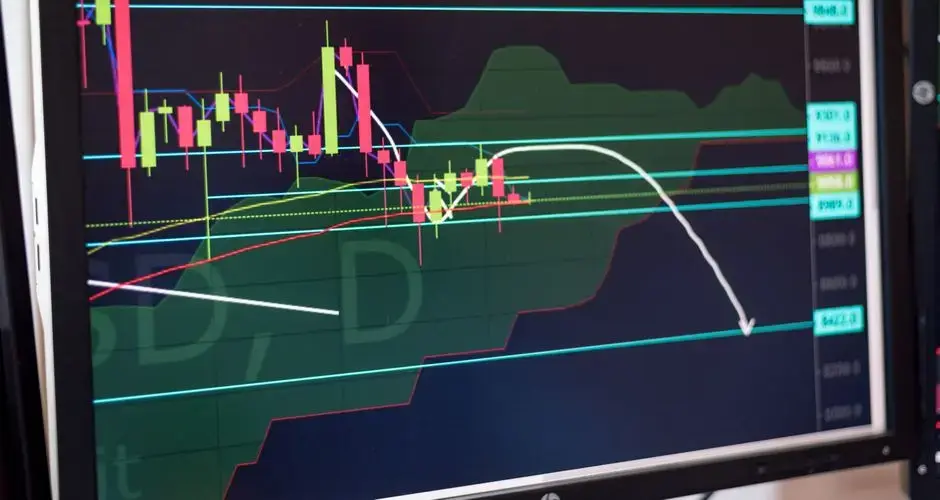
Direct Answer
Validating a support or resistance level means checking how many times it has been tested and held, whether it aligns with other technical factors (confluence), whether it holds across multiple timeframes, and whether recent tests came on meaningful volume rather than thin, low-conviction trading. A level tested and held multiple times with real volume behind those tests is generally treated as more reliable than a level identified from a single prior touch.
Key Takeaways
- Test count matters - a level held two or more times carries more weight than one identified from a single touch.
- Confluence, where a level lines up with a prior swing point, moving average, trendline, or round number, adds independent confirmation.
- A level that appears consistently across multiple timeframes is generally stronger than one visible only on a short intraday chart.
- Volume behind a test reflects real participation - a bounce on thin volume says less than a bounce on heavy volume.
- No single check is decisive on its own; validation is about weighing several factors together, not any one signal.
- Even a well-validated level can fail on the next test - validation improves the odds, it does not guarantee an outcome.
What Are the Four Checks for Validating a Level?
Support and resistance levels start as an observation: price approached a certain area and reversed. That observation alone does not tell you whether the level reflects a real concentration of buying or selling interest, or whether it was a coincidence of where a particular candle happened to close. Four checks help separate the two.
| Check | What it asks | Why it matters |
|---|---|---|
| Test count | How many separate times has price approached this level and reversed? | Repeated holds suggest a persistent concentration of orders, not a one-off reaction. |
| Confluence | Does the level line up with a prior swing high/low, a moving average, a trendline, or a round number? | Independent methods agreeing on the same price area reduces the odds it's coincidental. |
| Multiple timeframes | Does the level show up on higher timeframes (daily, weekly), not just an intraday chart? | Higher-timeframe levels tend to reflect a broader base of participants rather than short-term noise. |
| Volume | Did the tests that held occur on meaningful volume, or on thin, low-conviction trading? | Volume reflects actual participation behind the price reaction, not just where a candle happened to stop. |
Why Does Test Count Matter?
A level drawn from a single touch is a hypothesis, not a confirmed level. Price could have reversed there for reasons unrelated to any real order concentration - a news headline, a broader market move, or simple noise. Each additional time price approaches that same area and holds adds evidence that something structural is happening there, such as a cluster of resting orders, a prior breakout point now acting as support, or a level widely watched by other market participants.
This does not mean more tests always make a level stronger without limit - a level tested very frequently in a short window can also be a sign it is close to being exhausted, since each test can use up some of the orders resting at that price. Test count is one input to weigh alongside the others, not a simple "more is always better" rule.
What Is Confluence, and Why Does It Add Confidence?
Confluence describes a price level that multiple independent technical methods all point to at roughly the same area. For example, a prior swing high from several weeks ago, a widely watched moving average like the 200-day, and a round psychological number such as $100 might all sit within a narrow price band. None of those three factors alone is decisive, but their overlap is a stronger signal than any one of them individually, because they were derived from unrelated logic - price action history, a trend-following average, and a behavioral round number - and still arrived at the same conclusion.

Confluence is not a guarantee that a level holds. It is a way of prioritizing which levels deserve more attention when several candidates are visible on a chart, and of understanding why a particular level might attract more participation than a level with no supporting factors.
Why Check Multiple Timeframes?
A level that only appears on a 5-minute or 15-minute chart reflects the behavior of a narrower, more short-term-focused set of participants. The same price area checked on a daily or weekly chart may show nothing notable at all, or it may reveal that the level coincides with a much more significant historical turning point. Levels that hold consistently across timeframes - visible on the daily chart and respected intraday as well - tend to draw attention from a wider range of participants, from short-term traders to longer-horizon investors, which can reinforce why the level continues to matter.
In practice. This means starting from a higher timeframe to identify the more significant levels, then confirming how price behaves around that same area on a lower timeframe used for entries or exits, rather than treating every timeframe as an independent source of new levels.
Why Does Volume Confirmation Matter?
Two bounces off the same price level can look identical on a price chart and still mean very different things once volume is considered. A test that occurs on meaningful volume reflects real participation and conviction - enough buyers or sellers were active at that price to reverse the move. A test on thin, low-conviction volume may simply mean few participants were trading at that moment, and the level held more by default than by demonstrated demand or supply.
Volume is a supporting factor, not a standalone signal. A level with strong test count and confluence but consistently thin volume behind its holds is generally treated with more caution than a level backed by all four checks together.
An Illustrative Scenario
Consider a trader looking at a stock that has approached the $50 area three separate times over several months on the daily chart, reversing higher each time. On closer inspection, $50 also happens to sit near a prior breakout point from earlier in the year and close to the stock's 200-day moving average - two additional factors beyond the price reaction itself. Checking the intraday chart shows the same $50 area also attracting buying activity on a shorter timeframe, and the two most recent daily tests occurred on volume noticeably above the stock's typical daily average.
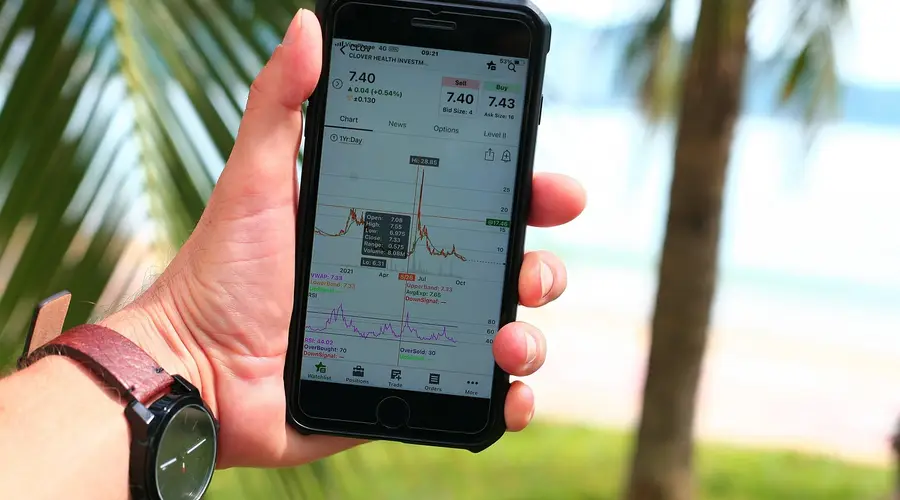
Against a hypothetical second level - a price the stock touched only once, several weeks ago, on a quiet trading day with no other technical factor nearby - the $50 level has more supporting evidence across all four checks: repeated tests, confluence with a prior breakout and a moving average, consistency across timeframes, and volume behind the holds. That does not guarantee $50 holds on the next test, but it is a meaningfully more validated level than the single-touch alternative.
Common Mistakes When Validating Levels
| Mistake | Why it's a problem | Better practice |
|---|---|---|
| Drawing a level from a single touch and treating it as confirmed | One reversal can be coincidence; it hasn't demonstrated it will hold again. | Wait for at least one additional test, or look for confluence, before treating a single-touch line as significant. |
| Ignoring volume entirely | A hold on thin volume reflects less real conviction than one supported by heavier participation. | Check volume on the candles or bars where price actually tested the level, not just the overall trend in volume. |
| Only checking one timeframe | A level that looks solid intraday may have no significance on a daily or weekly chart, and vice versa. | Confirm a level's presence on at least one higher timeframe before relying on it heavily. |
| Treating a validated level as guaranteed to hold | Even a level with strong test count, confluence, multiple-timeframe presence, and volume can still fail on the next approach. | Use validation to weigh probability and risk, not as a certainty; plan for the level failing as well as holding. |
Validation Raises the Odds and Your Confidence Unequally
The four checks are worth running, and they carry a risk of their own. Every one of them makes a level feel more solid, and the feeling grows faster than the actual improvement in the odds. A level that has held three times on good volume with confluence behind it is still a level that can fail on the next test, and the position sized as though it cannot is the expensive version of that mistake.
There is also a selection problem sitting underneath the whole exercise. You only draw a level where price has already reversed, which means every candidate in your list was chosen for the behaviour you are now assessing. The test count check is genuinely informative about whether something structural is there, but it is counting successes inside a sample that was selected on success.
Treat the checks as weights rather than a score. Two tests, weekly-chart confirmation, real volume and independent confluence pull in the same direction, and no single one of them settles the question. A level failing one check is not disqualified; it is a level you would take less size on, or require more from before acting.
The most practical habit is deciding what would falsify the level before price gets there. If a clean close through it on heavy volume would change your read, say so in advance, because in the moment that close arrives it is remarkably easy to reclassify it as a wick, a fakeout or a test of the zone rather than the level.
Frequently Asked Questions
How many times does a level need to hold to be considered valid?
There is no fixed universal number, but a level that has been tested and held at least twice is generally treated as more meaningful than one identified from a single touch, since a single touch could simply be where price happened to reverse for unrelated reasons. Each additional hold on real volume adds confidence, though a level can also fail on any given test regardless of how many times it previously held.
What is confluence in support and resistance analysis?
Confluence means a price level lines up with more than one independent technical factor, such as a prior swing high or low, a round number, a moving average, or a trendline, at roughly the same price. A level with confluence is generally treated as more reliable than one identified from price action alone, because multiple unrelated methods are pointing to the same area.
Why does volume matter when validating a support or resistance level?
A test that occurs on meaningful volume reflects real participation and conviction behind the buying or selling at that level, while a test on thin, low-conviction volume may simply mean few participants were active and says less about whether the level would hold under real pressure. Volume is one input among several, not a standalone signal.
Should support and resistance be checked on more than one timeframe?
Yes. A level that holds only on a very short intraday timeframe but has no presence on a daily or weekly chart is generally considered weaker evidence than a level that appears consistently across multiple timeframes, since higher-timeframe levels tend to reflect a broader base of market participants rather than short-term noise.
Does each successive test make a level stronger or weaker?
Both arguments are made and neither is established. One holds that repeated defence demonstrates real interest at the price. The other holds that each test consumes some of the orders sitting there, so a level tested many times is closer to breaking. They cannot both be generally true, and which applies in a given case is not observable from the chart. Treating either as a rule is asserting more than the evidence supports.
What is the difference between a touch and a test?
A touch is price reaching the level, which is a matter of record. A test implies a reaction followed, which is an interpretation applied afterwards. The distinction matters because validation counts usually mean tests, and identifying a test requires deciding what counts as a reaction. Counting touches is objective and counts more events; counting tests is the more meaningful measure and is not reproducible without a stated rule.
Does the time between tests matter?
It is worth considering, since tests separated by years involve a largely different set of participants than tests separated by days. The argument for a level rests on someone remembering or having orders at that price, and that becomes less plausible as the gap widens. Nothing quantifies this, but a level whose two touches sit years apart is a weaker claim than the count alone suggests.
How do you assess a level that has only formed once?
Not by test count, since there is nothing to count. The alternatives are the other checks: whether other independent factors point at the same price, whether the volume at that level was substantial, and whether it appears on more than one timeframe. A single-touch level with no supporting evidence is a mark on a chart, and treating it as validated is where most spurious levels come from.
Can a level become invalid without being broken?
Yes, when the thing that created it changes. A corporate action that rescales the price series moves every historical level. A change in the instrument itself, such as a merger or a contract specification change in futures, breaks the continuity the level assumed. Levels drawn from a period before such a change describe a security that no longer exists in the same form.