
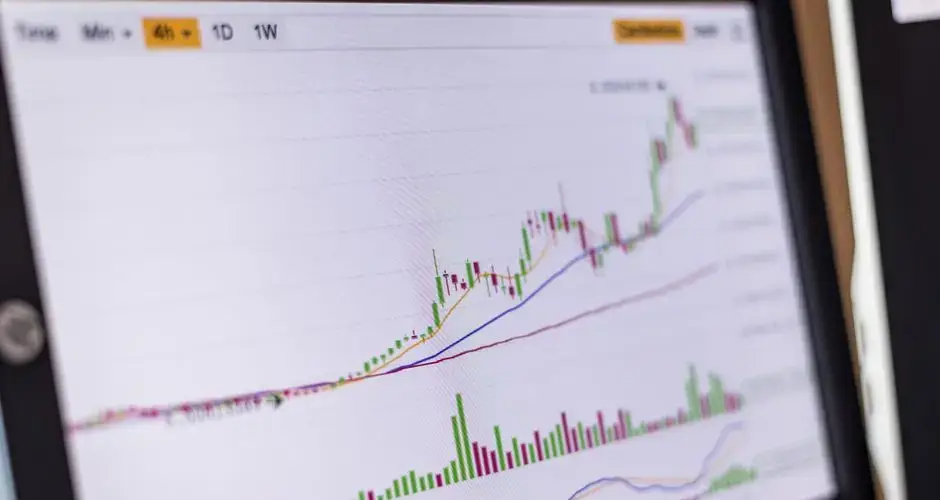
Direct Answer
Timeframe alignment is when the trend or signal on multiple chart timeframes, such as daily, weekly, and monthly, all point in the same direction. Some technical analysts treat this agreement as a stronger, higher-conviction setup than a signal appearing on only one timeframe, and some traders use the degree of alignment as an explicit filter or scoring input in their trading process.
Key Takeaways
- Timeframe alignment means the trend or signal agrees across two or more chart timeframes, such as daily, weekly, and monthly.
- Alignment is a form of confirmation: it does not create a signal on its own, it adds context to a signal that already exists on one timeframe.
- Some traders use alignment as a binary filter (trade only when aligned) while others use it as one input in a broader scoring system.
- Higher timeframes are generally treated as context for the dominant trend, with lower timeframes used for entry and exit timing.
- Timeframes can and do disagree with each other, which some traders read as a lower-conviction or conflicting signal.
- Alignment describes agreement between timeframes, not certainty about future price direction.
- The specific timeframes and number of timeframes used vary by trading style, from intraday scalping to long-term position trading.
What Timeframe Alignment Looks Like
A chart timeframe is simply the interval each candle or bar represents: a daily chart shows one candle per trading day, a weekly chart shows one candle per week, and a monthly chart shows one candle per month. The same security can display a different apparent trend depending on which timeframe is viewed, since a short-term pullback on a daily chart can be barely visible on a monthly chart that spans years of price history.
Alignment occurs when the trend direction, or a specific signal such as a moving average crossover or a breakout, appears consistently across the timeframes a trader is watching. For example, if the weekly chart is in an uptrend, the daily chart is also in an uptrend, and a short-term momentum indicator on an hourly chart is also pointing higher, those three timeframes are aligned. If instead the weekly chart is trending down while the daily chart is attempting to rally, the timeframes are not aligned, and a trader following alignment as a filter would treat that setup with more caution.
Why Traders Look at Multiple Timeframes
A signal that appears on only one timeframe reflects the price action of that timeframe alone. A single-timeframe signal can be a genuine turning point, or it can simply be short-term noise inside a larger, opposing trend. Checking additional timeframes gives a trader more context: a bullish signal on a daily chart that also aligns with an uptrend on the weekly chart is happening inside a broader trend that is already moving in the same direction, rather than working against it.
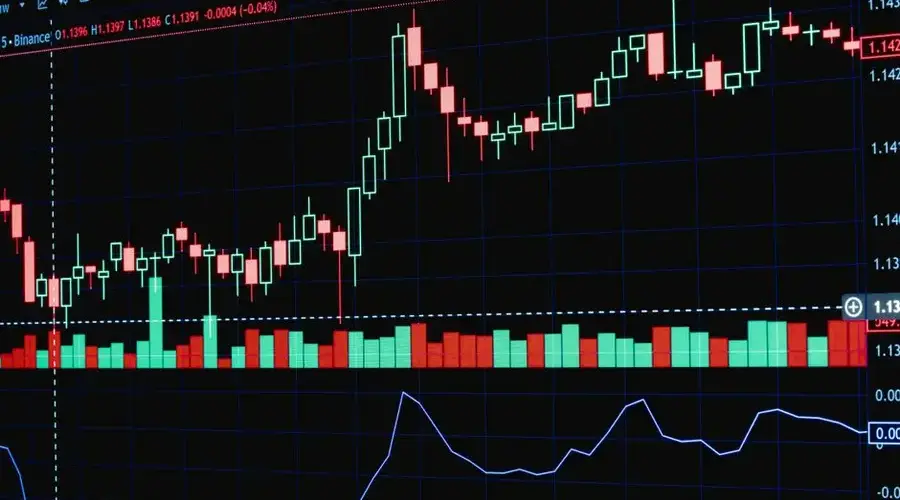
This is why some analysts describe multi-timeframe alignment as a way to filter for higher-conviction setups rather than a way to generate new signals. The signal itself, such as a candlestick pattern, a support or resistance test, or an indicator crossover, still comes from technical analysis on an individual chart. Alignment across timeframes is layered on top of that signal as additional context, sometimes formalized as an explicit scoring input where each aligned timeframe adds to a setup's score.
A Practical Scenario
Consider a trader who watches a monthly chart for the long-term trend, a weekly chart for the intermediate trend, and a daily chart for entry timing. Suppose the monthly chart shows a security in a long-running uptrend, the weekly chart shows the same security has recently confirmed a higher high, and the daily chart is now showing a bullish reversal pattern near a support level. In this scenario, all three timeframes point in the same direction, which is what timeframe alignment describes.
By contrast, if the daily chart shows the same bullish reversal pattern but the weekly and monthly charts are both in clear downtrends, the timeframes are not aligned. A trader who treats alignment as a filter might skip that setup or size it smaller, since the daily signal is working against the dominant trend on longer timeframes rather than with it.
Limitations and Common Mistakes
- Alignment is not a guarantee. Aligned timeframes can still reverse together, and a well-aligned setup can still lose.
- Misalignment does not mean a trade will fail. Countertrend moves against a higher timeframe can still work, particularly for short-term traders.
- Cherry-picking timeframes. Choosing timeframes after the fact to confirm a desired conclusion undermines the purpose of using alignment as an objective filter.
- Treating alignment as a standalone signal. Alignment adds context to an existing signal; it is not a substitute for having a signal in the first place.
- Ignoring how much weight each timeframe should carry. Some traders weight higher timeframes more heavily than lower ones, and inconsistency in that weighting can make alignment scoring subjective.
Alignment Modifies a Signal It Cannot Create
Alignment is a multiplier applied to something that already exists. Three timeframes all trending up is not, by itself, a reason to buy; it describes the condition in which an actual setup would be favourably positioned. Without a signal on one of those charts, alignment leaves you with a pleasant-looking arrangement and nothing to act on, and treating the arrangement as the trade is the most common way this concept gets misused.
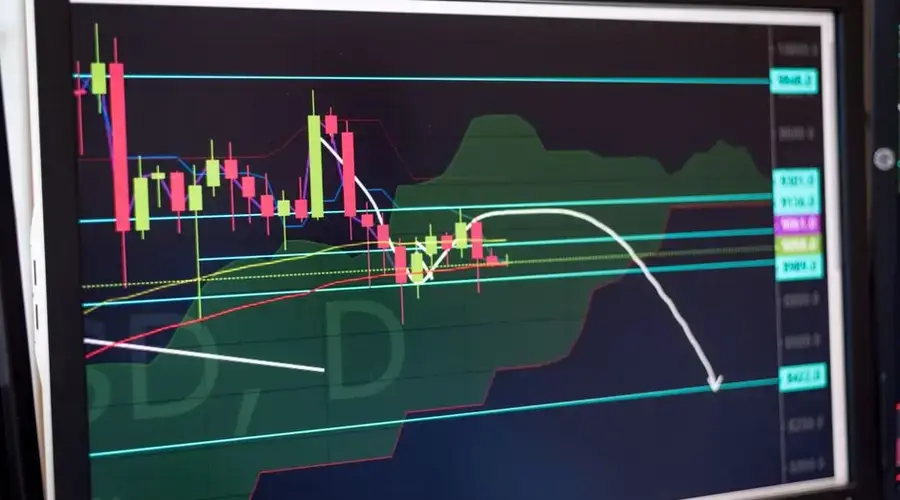
The second point worth internalising is that aligned timeframes can turn together. They are views of one market, not independent observers, so the agreement between them is less evidential than three separate confirmations would be. A well-aligned setup that fails has not malfunctioned; it has done the thing that a favourable but uncertain arrangement does some of the time.
Misalignment deserves the mirror caution. A counter-trend move against a higher timeframe can work perfectly well, particularly over a short holding period, so treating any disagreement as an automatic veto discards a category of trades rather than filtering a bad one.
Whichever way you use it, fix the timeframes and their weighting in advance. Choosing which charts count once you can see which ones agree turns an objective filter into a search, and weighting that shifts from trade to trade makes any alignment score you produce uninterpretable later.
Frequently Asked Questions
What is timeframe alignment in trading?
Timeframe alignment is when the trend or signal on multiple chart timeframes, such as daily, weekly, and monthly, all point in the same direction. Some technical analysts treat this agreement as a stronger, higher-conviction setup than a signal that appears on only one timeframe.
How many timeframes should I check for alignment?
There is no single standard number. Many traders use a simple three-tier structure, such as a higher timeframe for context, an intermediate timeframe for the trend, and a lower timeframe for entry timing, but the exact combination varies by trading style and holding period.
Does timeframe alignment guarantee a trade will work?
No. Timeframe alignment is a filter or scoring input some traders use to favor certain setups, not a guarantee of outcome. Aligned timeframes can still reverse, and misalignment does not mean a trade will necessarily fail.
Can timeframes disagree with each other?
Yes. It is common for a shorter timeframe to show a countertrend move against a longer timeframe's dominant trend. Traders who use alignment as a filter generally treat this disagreement as a lower-conviction or conflicting signal.
Is alignment a yes or no state, or a matter of degree?
A matter of degree, and treating it as binary discards most of the information. Three charts out of four agreeing is a different situation from four out of four, and from two out of four. Partial alignment is the ordinary case rather than the exception, so a framework that only recognises full agreement will spend most of its time reporting nothing.
Does alignment occur more often in some conditions than others?
Yes. Sustained trends produce agreement across many resolutions almost by construction, because the same direction is present at every scale. Transitions produce disagreement, since the faster charts register the change first and the slower ones lag. Alignment is therefore concentrated in the middle of moves and absent at the turns, which shapes what a rule requiring it will and will not catch.
Can timeframe alignment be quantified?
Straightforwardly, once a single trend definition is applied to every chart in the set. Counting how many satisfy it turns a visual impression into a number that can be recorded, compared and tested. The quantification does not make the underlying trend definition any less arbitrary, but it does make the alignment read reproducible, which a chart-by-chart glance is not.
Does alignment across many timeframes mean a move is already advanced?
Often, and it is the structural cost of the approach. A monthly chart cannot confirm a direction until enough monthly bars have printed in it, by which point the move has been running for some time. Requiring agreement from slow charts therefore selects for moves that are established rather than beginning. That is a deliberate tradeoff and it should be recognised as one.
What is the cost of waiting for full alignment?
Fewer setups and later entries. Requiring every chart in a set to agree cuts the qualifying occasions sharply, and each one arrives after the slowest chart has confirmed. Whether that trade is worthwhile depends on how much the alignment requirement improves the outcomes it does allow, which needs measuring rather than assuming, and the smaller sample makes that measurement harder.