
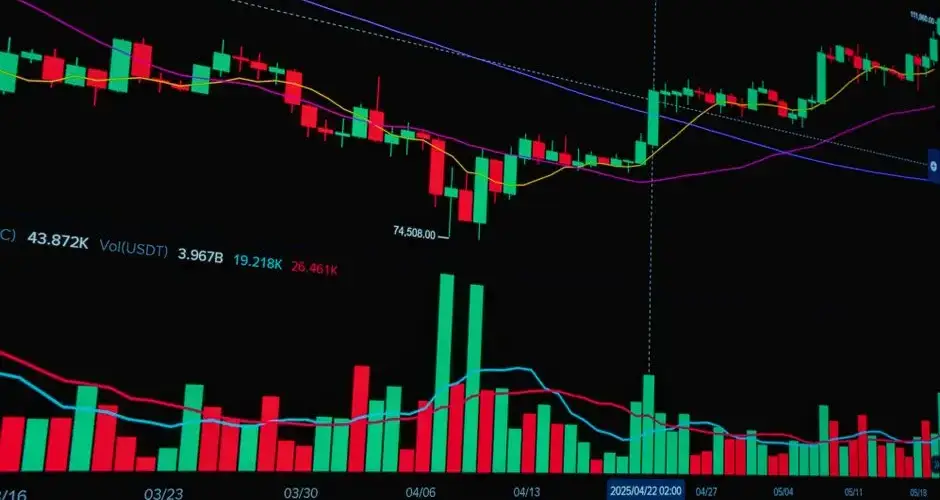
Direct Answer
Multi-timeframe volume analysis means examining trading volume on more than one chart interval before deciding whether a reading is significant. A spike that looks dramatic on a 5-minute or hourly chart may represent only a small fraction of the security's typical daily volume, so checking the longer timeframe helps traders avoid over-reacting to activity that is locally unusual but globally unremarkable.
Key Takeaways
- Volume that looks extreme on a short timeframe can be ordinary once compared against the security's typical daily, weekly, or monthly volume.
- Cross-checking volume across intervals is a filtering step, not a standalone predictive signal for price direction.
- Short timeframes have smaller sample sizes, which makes their volume readings naturally noisier and more prone to false alarms.
- Cumulative session volume compared against a rolling average daily volume is a common way to judge whether a day is genuinely active.
- Combining volume across timeframes with price context (support/resistance, trend) gives a fuller picture than volume alone.
- Low-liquidity securities can show large percentage volume swings on short timeframes purely from statistical noise, not new information.
- Multi-timeframe volume checks are most useful before treating an intraday move as a reason to change a longer-term view.
What Is Multi-Timeframe Volume Analysis?
Multi-timeframe volume analysis examines trading volume patterns across more than one chart interval, such as comparing whether a volume spike visible intraday is also significant relative to the security's typical daily volume. A trader looking only at a 15-minute chart might see a bar with three times the volume of the bars around it and assume something important just happened. Viewed against the stock's typical daily volume, that same burst of activity might amount to a small, unremarkable share of a normal day's turnover.
The core idea is that "unusual" is always relative to a baseline, and the baseline changes depending on the timeframe being observed. A short interval like a 1-minute or 5-minute bar has a small, noisy sample of trading activity, so it takes very little extra buying or selling to make one bar look tall relative to its neighbors. A daily or weekly bar aggregates far more activity, smoothing out that noise and giving a more stable reference point for what counts as genuinely high volume.
Why Cross-Checking Volume Across Timeframes Matters
Traders and analysts often use volume as a confirmation tool, a price move accompanied by high volume is generally read as more convincing than the same move on light volume. If the "high volume" reading is only high relative to a very short and noisy timeframe, that confirmation can be misleading. Cross-checking against a longer timeframe helps separate a genuinely unusual event, such as news-driven institutional activity, from routine short-term fluctuation.
Consider a security that typically trades several million shares a day. An hourly bar showing an above-average share of that volume concentrated in one hour is a more meaningful signal than a 5-minute bar showing an above-average share of the surrounding 5-minute bars, because the hourly reading is being measured against a bigger, steadier baseline. Traders who skip this step risk treating routine short-interval noise as if it were a broader shift in participation.
A practical illustration: imagine a stock's 5-minute volume jumps to well above its recent 5-minute average right after the market open. Because opening minutes are naturally higher-volume across almost all stocks, that reading may simply reflect the normal open-of-day pattern rather than anything unusual once compared against the stock's typical volume for that time of day, or against its average full-day volume by midday.
Limitations and Common Mistakes
- Treating any short-timeframe spike as significant. Without a longer-timeframe comparison, small-sample noise is easy to mistake for a meaningful shift in participation.
- Ignoring time-of-day patterns. Volume is naturally higher near the open and close for most securities; comparing an early-morning bar only to midday bars can create a false impression of unusual activity.
- Using volume in isolation. Volume readings are most useful alongside price action and context (trend, support/resistance, news), not as a standalone signal of direction.
- Assuming volume analysis predicts direction. An unusual volume reading, confirmed across timeframes, indicates elevated interest, it does not by itself say whether that interest is bullish or bearish.
- Overlooking low-liquidity distortion. Thinly traded securities can show large percentage volume swings from a handful of trades, which can look dramatic on any timeframe without reflecting a real change in interest.
Small Samples Make Big Percentages
The statistical point underneath this page does most of the work. A five-minute bar contains a small number of trades, and small samples swing wildly in percentage terms for reasons that carry no information. A bar showing triple its neighbours can represent a rounding error against the day, which is why the same reading looks alarming on the short chart and disappears entirely once compared against typical daily volume.
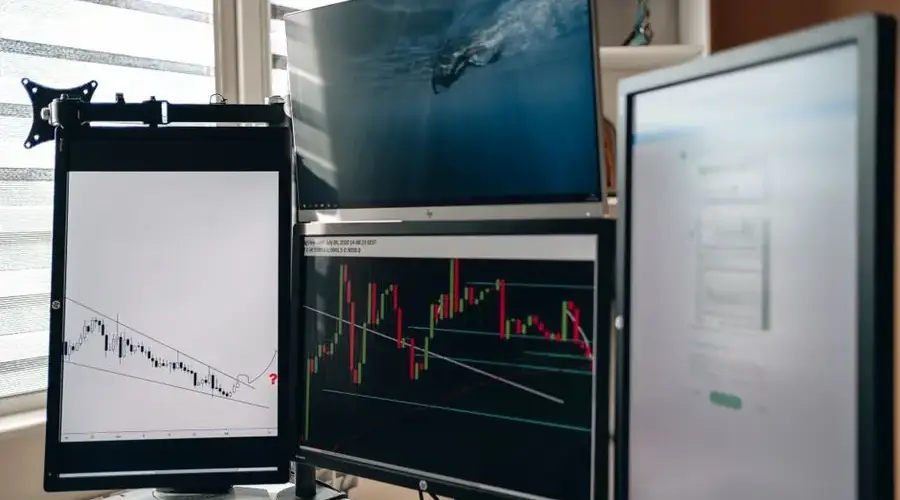
The comparison worth making is cumulative session volume against a rolling average daily figure. That answers whether the day as a whole is genuinely active, which is usually the question you meant to ask, rather than whether one bar was busy relative to the two before it.
Layer the time-of-day pattern on top. Volume concentrates near the open and the close for most instruments, so an early bar judged against midday bars will look extraordinary as a matter of routine. A benchmark that ignores the shape of the session manufactures unusual readings twice a day, every day.
Two things this check cannot do. It does not indicate direction, since confirmed elevated interest tells you participation is high and nothing about which side is winning. And in thinly traded instruments the noise problem compounds rather than resolving, because every timeframe is built from a small number of trades and there is no longer view in which the sample gets large.
Frequently Asked Questions
What is multi-timeframe volume analysis?
Multi-timeframe volume analysis is the practice of examining trading volume across more than one chart interval, such as comparing a 5-minute or hourly volume reading against the security's typical daily volume, so a locally unusual spike can be checked against a broader baseline.
Why can a volume spike look unusual on one timeframe but normal on another?
A short timeframe has a much smaller sample of typical activity than a longer one, so a burst of trades in a single 5-minute bar can look extreme relative to nearby bars while representing a small fraction of the security's average daily volume, which is the broader reference point.
How do traders compare volume across timeframes?
Traders typically look at the shorter timeframe's volume relative to its own recent bars, then check the cumulative volume for the session or period against the security's typical daily, weekly, or monthly volume to see whether the reading still stands out at the larger scale.
Does multi-timeframe volume analysis predict price direction?
No. It is a filtering technique that helps assess whether a volume reading is genuinely unusual rather than a normal feature of a shorter interval; it does not by itself indicate which direction price will move.
Is volume additive across timeframes in a way price is not?
Yes, and it is the structural difference that makes volume easier to reason about across resolutions. A weekly volume figure is exactly the sum of its daily figures, so nothing is lost in aggregation. Price is not additive: a weekly bar keeps four values out of a whole week of movement and discards the rest. Volume aggregates cleanly; price aggregates lossily.
What is relative volume, and how does timeframe affect it?
Relative volume compares current volume against a typical figure for the same point in the cycle, usually expressed as a multiple. On a daily chart the comparison is against an average of recent days. Intraday it has to compare against the same time of session, because volume follows a strong within-day shape. An intraday relative volume computed against a flat average will report the open as extraordinary every day.
Can an intraday volume spike be invisible on the daily bar?
Easily. A burst concentrated in one hour can leave the daily total within its normal range, because the rest of the session was quiet enough to absorb it. The daily chart then shows nothing unusual while the intraday chart shows a clear event. This asymmetry runs one way only: anything large enough to move the daily total is visible intraday as well.
How does an incomplete higher-timeframe bar distort a volume comparison?
A weekly bar examined on Tuesday holds two sessions of volume, so comparing it against completed weeks understates it by more than half. The same applies to a monthly bar early in the month. Because the partial bar is drawn the same way as the finished ones, the comparison looks valid. Either scale the partial figure to the elapsed fraction or exclude it, but do not read it as a completed period.
Should volume be compared in shares or in value traded?
Value traded, which is volume multiplied by price, is the more portable measure. Share counts are not comparable between a security trading in single digits and one trading in the hundreds, and they are not comparable for a single security across a period in which its price changed substantially. Value traded normalises both cases, at the cost of mixing a price change into the activity measure.
References
Disclaimer
This content is for educational purposes only and does not constitute investment, financial, tax, or legal advice. Technical analysis techniques, including volume analysis. Do not guarantee future results. Swoopr Investment does not recommend any specific security or trading strategy. Consult a licensed financial professional before making investment decisions.