
Direct Answer
Lower-timeframe execution means using a shorter chart interval, such as an hourly or 15-minute chart, to fine-tune the entry price and timing of a trade after the broader trend has already been read on a higher timeframe, such as the daily chart. The idea is to combine the higher timeframe's more reliable trend read with the lower timeframe's more precise timing for getting in.
Key Takeaways
- Lower-timeframe execution is a timing step, not a direction-finding step, the trend call happens on the higher timeframe first.
- A typical pairing is a daily chart for trend and an hourly or 15-minute chart for entry, though the specific pairing varies by trader and holding period.
- The goal is to combine the higher timeframe's more reliable trend read with the lower timeframe's more precise entry timing.
- It is one piece of a broader multi-timeframe analysis approach, not a standalone trading system.
- Lower timeframes carry more noise, so signals there are read in the context of the higher-timeframe trend, not on their own.
- A common failure mode is letting lower-timeframe noise override the higher-timeframe direction the trader already committed to.
- The approach applies across markets and instruments wherever a trader distinguishes between "what direction" and "when to get in."
What Is Lower-Timeframe Execution?
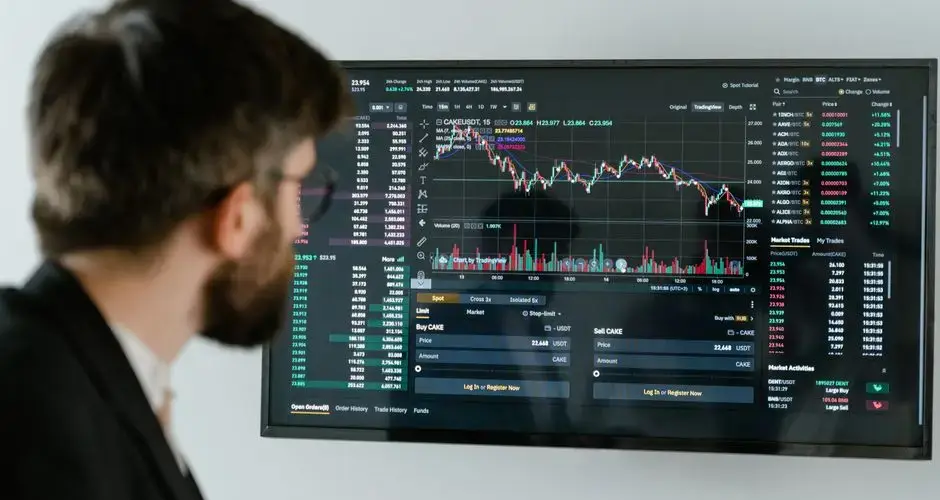
Every chart interval shows the same price history at a different resolution. A daily chart compresses each trading day into a single candle, smoothing out intraday swings and making the broader trend easier to see. A 15-minute or hourly chart shows far more detail about how price moved within that same period, including pullbacks, spikes, and short-lived reversals that never show up on the daily view.
Lower-timeframe execution is the practice of using that extra detail for a specific, narrow purpose: once a trader has already decided which direction they want to trade based on a higher timeframe, they drop down to a shorter interval to look for a more precise moment and price to actually enter. The higher timeframe answers "which way," and the lower timeframe answers "when and at what price."
This is a component of multi-timeframe analysis more broadly, which looks at the same instrument across several chart intervals before acting. Lower-timeframe execution specifically refers to the entry-timing half of that process, as distinct from the trend-identification half that happens on the higher timeframe.
Why Combine Timeframes for Entries?
Each timeframe on its own involves a tradeoff. A higher timeframe like the daily chart filters out a lot of short-term noise, which tends to make its trend read more reliable, but by the time a trend is visible on the daily chart, the entry price it implies is coarse; a trader waiting for daily confirmation may already be entering well after the move started, at a less favorable price.
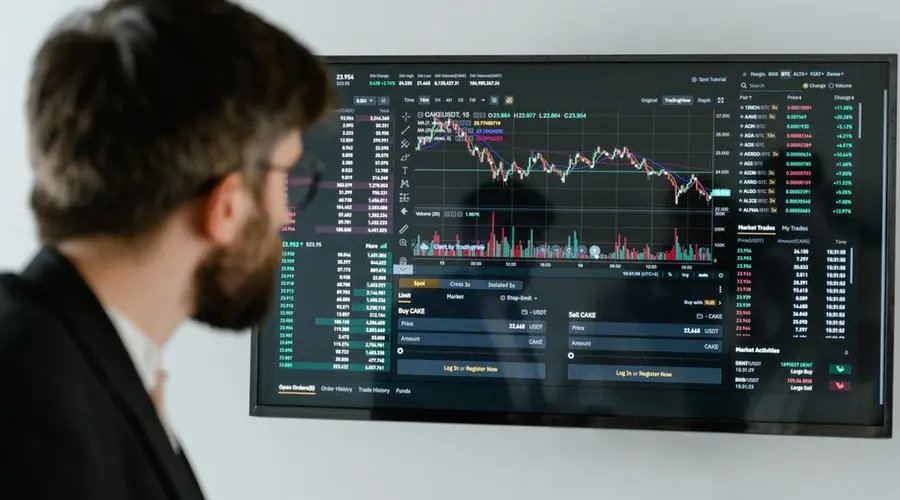
A lower timeframe like the hourly or 15-minute chart shows far more granular price action, which allows for a tighter, more specific entry price and moment. But that same granularity means it is noisier and less reliable as a standalone signal of direction, a short-term dip or spike on a 15-minute chart can look significant in isolation while being irrelevant to the broader trend.
Using the higher timeframe to establish direction and the lower timeframe only to time the entry is one way traders try to get the benefit of both: a trend read they trust more, combined with an entry that is more precise than simply acting on the higher timeframe alone.
An Illustrative Scenario
Consider a trader who reviews a daily chart and concludes that an instrument is in an uptrend based on the pattern of higher highs and higher lows over recent weeks. Rather than buying immediately at whatever price is showing on the daily chart. The trader switches to an hourly chart of the same instrument. There, they can watch for a short-term pullback or a specific pattern within the broader uptrend, and use that lower-timeframe detail to choose an entry price and moment that would not be visible from the daily chart alone.
The daily chart did the work of establishing that the trader wants to be a buyer, not a seller. The hourly chart did the work of refining exactly when and around what price that buy happens. Neither timeframe replaces the other in this process, each is used for the task it is comparatively better suited to.
Limitations and Common Mistakes
- Letting the lower timeframe override the trend call. The most common mistake is treating lower-timeframe noise as a reason to abandon or reverse the higher-timeframe direction, rather than using it only for timing.
- Over-trading on lower-timeframe signals. Because shorter intervals generate far more candles and patterns, they can tempt a trader into acting on signals that would not meet the same bar on a higher timeframe.
- Ignoring the noise tradeoff. Lower timeframes are inherently less reliable for direction; treating a lower-timeframe pattern as equally trustworthy as a higher-timeframe one can lead to weaker trade decisions.
- No fixed rule for which timeframes to pair. The specific higher/lower pairing, such as daily-to-hourly versus weekly-to-daily, depends on a trader's own holding period and strategy rather than a universal standard.
- Treating it as a complete system. Lower-timeframe execution addresses entry timing; it does not by itself address position sizing, stop placement, or exit strategy, which are separate decisions.
The Entry Chart Does Not Get a Vote on Direction
The boundary that makes this approach work is narrow and easy to erode. The higher timeframe decides direction. The lower timeframe decides where and when, and that is the whole of its remit. The failure mode is not dramatic: you drop to the fifteen-minute chart to time an entry into a daily uptrend, see something bearish there, and quietly reconsider the trade. At that moment the timing tool has become the direction tool, and the higher-timeframe work has been discarded.

Being explicit about this in advance is the defence. Write down what the lower timeframe is allowed to change, which is usually the entry price, the trigger and possibly the stop placement, and what it is not allowed to change, which is whether the trade happens at all.
The volume of signals on the entry chart makes this pressure constant. A fifteen-minute chart generates many more patterns per day than a daily chart generates per month, and most of them would not qualify as setups at the higher resolution. They are not being offered as trades; they are being offered as entries into a trade you already decided on.
There is also no standard pairing to adopt. Daily with hourly, weekly with daily and four-hour with fifteen-minute are all in use, and the right gap depends on how long you intend to hold. Choose it for that reason rather than because it appeared in an example.
Frequently Asked Questions
What is lower-timeframe execution?
Lower-timeframe execution is the practice of using a shorter chart interval, such as hourly or 15-minute, to fine-tune the entry price and timing of a trade after the broader trend has already been identified on a higher timeframe, such as the daily chart.
Which timeframe should set the trend and which should time the entry?
The higher timeframe, often daily or weekly, is typically used to establish the dominant trend direction because it filters out short-term noise. The lower timeframe, such as hourly or 15-minute, is then used to pinpoint a more precise entry once that direction is set.
Why not just trade off one timeframe?
A single timeframe forces a tradeoff between reliability and precision. Higher timeframes read trend direction more reliably but offer coarse entry timing, while lower timeframes offer precise timing but are noisier and less reliable on their own for direction.
What is a common mistake when combining timeframes?
A common mistake is letting lower-timeframe price action override the higher-timeframe trend read, effectively trading against the established direction based on short-term noise rather than using the lower timeframe only for timing.
What goes wrong when the execution timeframe is too fast?
The entry chart starts showing structure that is mostly microstructure: spread bounce, individual large orders, and the mechanical effects of how trades are reported. Those produce trigger conditions that look identical to real ones and have no relationship to the thesis being executed. The symptom is an entry chart generating far more setups than the thesis timeframe could ever justify acting on.
Does executing on a lower timeframe reduce risk or relocate it?
It changes the size of the loss if the thesis fails, not the probability that it does. A tighter entry allows a closer stop and therefore a smaller distance at risk per unit, which is a real benefit. What it also does is increase the chance of being stopped out by movement that does not invalidate the thesis at all, so the exposure moves from the size of the loss to the frequency of taking one.
What counts as a lower-timeframe entry trigger?
Anything that turns a decision already made on the higher chart into a specific bar. Common examples are a break of the previous bar high in the direction of the thesis, a close back above a level after a probe below it, or a small consolidation resolving. What they share is that none of them decides direction: they only decide when. A trigger that could point either way is not a trigger, it is a second opinion.
Can lower-timeframe execution be automated while the thesis stays discretionary?
Yes, and the boundary needs writing down. The usual arrangement has a person identifying the setup and the direction, and an automated rule watching for the trigger within defined bounds. What has to be explicit is what the automation may not do: open a position the thesis did not authorise, act after the setup has expired, or reverse direction on its own.
Does lower-timeframe execution work in illiquid instruments?
Poorly. In a thin market a fine timeframe shows individual prints and a wide spread rather than structure, so the chart consists largely of artefacts. The trigger conditions still fire, on movement that reflects one order rather than any balance of participants. Where liquidity is limited, the execution timeframe usually has to be coarser than the thesis timeframe would otherwise suggest.
References
Disclaimer
This content is for general educational purposes only and does not constitute personalized investment, financial, or trading advice. Trading and investing involve risk, including possible loss of principal. Swoopr Investment does not guarantee any specific outcome from applying the concepts described here. Consult a qualified financial professional before making investment decisions.