
Direct Answer
Reading overbought and oversold levels in context means interpreting them relative to the prevailing trend and market regime, not as fixed, universal thresholds. In a strong uptrend, an oscillator can remain overbought for extended periods while price keeps climbing, so treating every overbought reading as an automatic sell signal has historically been a common source of premature or losing trades.
Key Takeaways
- Overbought and oversold are relative descriptions of an oscillator's recent behavior, not fixed rules that trigger a trade by themselves.
- The same numeric reading can imply something very different depending on whether the underlying trend is strong, weak, or absent.
- In a sustained uptrend, an oscillator can stay pinned near overbought for an extended period while price continues to rise.
- Automatically selling or shorting on every overbought reading, regardless of trend, has historically been a common source of premature or losing trades.
- Context, trend direction, regime, and what the oscillator has typically done on this instrument recently, matters as much as the reading itself.
- An oversold reading in a strong downtrend carries the same caution in reverse: it can persist without marking a bottom.
Why Do Overbought and Oversold Readings Depend on Trend?
Bounded momentum oscillators, such as the RSI, are built from the ratio or balance of recent gains to recent losses over a lookback window. When a market is trending strongly higher, gains dominate losses in that window almost continuously, so the oscillator can sit near its upper bound, commonly labeled "overbought", for a long stretch, not just a brief spike. The oscillator isn't malfunctioning in that situation; it is accurately reflecting that upward momentum has been persistent and one-sided. The same logic applies in reverse during a strong downtrend, where an oscillator can stay pinned near "oversold" while price keeps falling.
This is the core reason a fixed numeric threshold, read without reference to trend, is an incomplete tool. A reading that would mark an extreme in a range-bound, choppy market can be an entirely ordinary feature of a strong trending market. Two instruments, or the same instrument at two different points in time, can post an identical oscillator reading while meaning very different things about what's likely to happen next, because the surrounding trend and regime differ.
An illustrative scenario
Consider a stock in a strong, sustained uptrend on rising volume and consistent higher highs. Its momentum oscillator climbs into overbought territory and stays there through several weeks of continued gains. A trader watching only the oscillator, and exiting or shorting every time it crosses into overbought, would have been stopped out or stepped aside repeatedly while the trend kept extending, each individual "overbought" reading looked identical on the chart, but the ones that occurred mid-trend behaved very differently from an overbought reading that shows up after the trend has already begun losing strength. This is illustrative, not a specific historical trade or a claim about any real ticker.
Common mistake
The common mistake is treating "overbought" and "sell" as synonyms, or "oversold" and "buy" as synonyms, independent of what the broader trend and regime look like. The oscillator reading is one input describing recent price behavior relative to its own history. It is not, by itself, a statement about what price does next.
How Traders Typically Adjust for Context
Because a fixed threshold behaves differently across regimes, common practice among technical traders is to first characterize the broader environment, is the instrument in a strong trend, a weak or choppy trend, or a defined range, before deciding how much weight to give an overbought or oversold reading. In a strong uptrend, some traders shift their expectation of what "overbought" even means for that instrument, treat a move to oversold as a pullback-buying opportunity within the trend rather than a reversal signal, or wait for independent confirmation, such as a break of trendline support or a change in the trend indicator itself, before acting on an overbought reading at all.
In a range-bound market with no clear directional trend, overbought and oversold readings tend to behave more the way they're often described in introductory material, as markers near the edges of the recent trading range, more likely to coincide with a turn back toward the middle of the range. The same oscillator, the same numeric threshold, and a materially different interpretation, purely because the trend context differs.
Common mistake
The common mistake here is applying a single interpretation rule across every instrument and every market condition. A threshold and reaction rule tuned for a range-bound stock can produce a stream of premature exits or failed short entries when mechanically applied to a stock in a strong, sustained trend, and vice versa.
Misconceptions Versus Reality
| Misconception | Reality |
|---|---|
| Overbought always means price is about to fall | An oscillator can remain overbought for extended periods during a strong, sustained uptrend |
| Oversold always means price is about to rise | An oscillator can remain oversold for extended periods during a strong, sustained downtrend |
| A fixed numeric threshold works the same in every market condition | The same reading can carry very different implications depending on the prevailing trend and regime |
| Overbought and oversold readings are standalone trade signals | They are one descriptive input among several, historically prone to generating premature or losing trades when used alone |
| Reading the oscillator "in context" removes the risk of being wrong | Context improves interpretation but does not make the reading predictive or precise |
Risks, Limitations, and Exceptions
- No amount of context turns an overbought or oversold reading into a precise or guaranteed signal, it remains a description of recent price behavior, not a forecast.
- Characterizing "trend" or "regime" itself involves judgment; different trend-identification methods can disagree about whether a given market is trending or range-bound at a given moment.
- Waiting for confirmation before acting on an overbought or oversold reading reduces some false signals but can also mean acting later, after a larger portion of a move has already happened.
- This page describes a general interpretive principle from technical-analysis practice; it does not recommend any specific threshold, oscillator, or trading rule for any instrument.
- The illustrative scenario on this page is a generic description built to demonstrate the concept, not a specific historical trade, backtest result, or performance claim.
What to Do When the Oscillator Pins
The situation this page is really about is a specific one: the oscillator has been sitting near its upper bound for days and has not come back. The instinct is to read that as an accumulating warning. The mechanics say otherwise. A bounded oscillator is built from the balance of gains and losses inside its lookback window, so when gains dominate that window continuously, a pinned reading is a description of the trend rather than a signal against it.
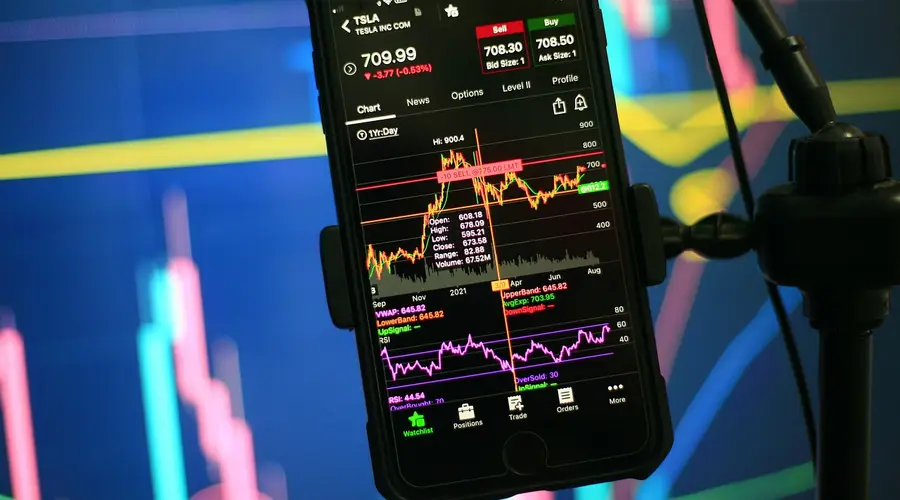
The costly response is the automatic fade: selling or shorting on the reading alone, on the reasoning that a stretched market must snap back. That trade is being taken against the trend on the word of an indicator that has no view on trend, and the reading can stay where it is for as long as the imbalance lasts.
A more workable sequence puts the regime question first. Characterise the environment as trending, weakly trending or ranging, then decide how much weight the reading deserves. In a range, an extreme reading is closer to what the threshold was designed to describe. In a strong trend, many traders shift the level they treat as meaningful, or drop the interpretation entirely and read the oscillator for direction instead.
Be honest about the limits of that step. Characterising a regime is judgment, different methods disagree on the same chart, and the label you assign can be stale by the time you act on it. Context makes an extreme reading more useful; it does not convert it into a forecast.
Frequently Asked Questions
What does it mean to read overbought and oversold in context?
It means interpreting an oscillator's overbought or oversold reading relative to the prevailing trend and market regime rather than treating a fixed level as a universal, standalone signal. The same numeric reading can mean something different in a strong uptrend than it does in a range-bound or downtrending market, because the oscillator's typical behavior shifts with the trend it's measuring.
Why can an oscillator stay overbought during a strong uptrend?
Most bounded momentum oscillators are built to reflect the strength and persistence of recent price moves. In a strong, sustained uptrend, gains keep dominating losses over the lookback period, so the oscillator can remain pinned near its upper bound for an extended stretch even as price continues climbing. The oscillator is describing sustained strength, not signaling that a reversal is imminent.
Is an overbought reading always a sell signal?
No. Treating every overbought reading as an automatic sell signal, regardless of trend, has historically been a common source of premature or losing trades, since it can trigger exits or short entries against a trend that continues for a long time afterward. The reading is one input describing recent price behavior, not a mechanical trade trigger on its own.
How should trend be factored in when reading overbought or oversold levels?
Common practice is to first characterize the broader trend or regime the instrument is in, then weight what an overbought or oversold reading likely implies accordingly. In a strong uptrend, some traders adjust their expectations for overbought thresholds, look for the oscillator to reach oversold as a pullback signal instead, or wait for confirmation such as a trend break before treating an overbought reading as meaningful. None of these adjustments make the reading a precise or guaranteed signal.
Where do the conventional thresholds of 70 and 30 come from?
They are the levels Welles Wilder used when he introduced RSI, and they were carried forward into charting defaults and into most published material afterwards. Nothing derives them from the distribution of readings on any particular instrument. They persist because they are shared, which does give them a coordination value, and that is a different thing from them being the right numbers.
Is an oscillator reading comparable between two different securities?
The number is comparable because bounded oscillators are scale free by construction, so a reading of 75 means the same thing arithmetically on any instrument. What is not comparable is the volatility that produced it. A quiet security reaching 75 has done something different from a volatile one reaching the same value, and the reading alone does not distinguish the two cases.
Do overbought and oversold mean anything on an unbounded oscillator?
Not without a reference range established for that instrument. An unbounded indicator has no ceiling to be near, so the terms are borrowed by analogy and have to be anchored to how far the series has historically travelled. That anchor is instrument specific and period specific, which means a threshold that identified extremes last year may not this year, and there is no default to fall back on.
Does the lookback period change how often extremes are reached?
Substantially. A shorter lookback computes the reading over fewer observations, so a run of same-direction bars pushes it to an extreme quickly and it returns just as fast. A longer lookback dilutes each new bar and reaches the extremes rarely. The threshold has not moved; the frequency with which the series crosses it has, which changes what an extreme reading is evidence of.
Are overbought and oversold statements about valuation?
No, and the words invite exactly that misreading. Both are descriptions of where recent price changes sit within their own recent range, computed from price alone. Nothing in the calculation touches earnings, cash flow, assets or any measure of what the security is worth. A security can be overbought and cheap at the same time without any contradiction, because the two terms are answering unrelated questions.
References
The interpretive principle described on this page, reading momentum-oscillator extremes relative to trend rather than as fixed universal thresholds, is a longstanding convention in technical-analysis practice and education. Key reference sources include:
- CMT Association, Technical Analysis Body of Knowledge and Research: cmtassociation.org: professional body of knowledge covering momentum oscillators and trend-context interpretation as core technical-analysis concepts.
This content was reviewed by the Swoopr Editorial Team in August 2026 and reflects publicly available information at that time.