
Key Takeaways
- Momentum divergence occurs when price and a momentum oscillator move in different directions at new price extremes.
- It's a general concept, not tied to one indicator, RSI divergence and MACD divergence are the two most commonly discussed forms, but the same logic applies to Stochastic, CCI, Rate of Change, and other oscillators.
- Bearish divergence: price makes a higher high while the oscillator makes a lower high, hinting that buying pressure is weakening.
- Bullish divergence: price makes a lower low while the oscillator makes a higher low, hinting that selling pressure is weakening.
- Divergence is a warning sign about the strength behind a move, not a precise timing signal or a guarantee of reversal.
- Many divergences appear early, persist through strong trends, or never resolve into a reversal at all, context and confirmation matter as much as the divergence itself.
Direct Answer
Momentum divergence is when price and a momentum oscillator move in different directions at new price extremes, for example, price sets a higher high while the oscillator sets a lower high. It suggests the buying or selling pressure behind the move may not be strong enough to support its continuation. The concept underlies indicator-specific forms like RSI divergence and MACD divergence, but applies broadly across momentum oscillators.
What Is Momentum Divergence?
A momentum oscillator, RSI, MACD, Stochastic, CCI, Rate of Change, and similar tools, measures the speed and strength of recent price changes, not price itself. Under normal conditions, when price pushes to a new high or low, the oscillator tends to confirm it, reaching a correspondingly higher or lower extreme of its own.
Divergence describes the moments when that relationship breaks down: price sets a new extreme, but the oscillator doesn't. The mismatch is read as a sign that the momentum driving the move, the pace at which buyers or sellers were pushing price, has slowed, even though price itself hasn't turned yet. It's a description of weakening underlying pressure, not a statement about what price will do next.
Bullish vs. Bearish Divergence
Divergence is defined by comparing two swing points, two highs, or two lows, on price and on the oscillator, and checking whether their directions agree.

Bearish divergence
Bearish divergence forms during an uptrend: price makes a higher high, but the oscillator makes a lower high at the same swing. Consider a stock that rallies to a new 52-week high while its RSI peaks lower than it did on the prior rally, fewer buyers are pushing as hard even though price is still climbing. That gap is read as a warning that upside momentum is fading, ahead of any change in price direction.
Bullish divergence
Bullish divergence forms during a downtrend: price makes a lower low, but the oscillator makes a higher low at the same swing. If a coin sells off to a new low while its MACD histogram bottoms at a shallower level than the prior low, selling pressure is arguably not accelerating the way price alone suggests. That's read as an early sign that downside momentum may be losing steam.
Why Momentum Divergence Matters
Price is a lagging summary of what already happened; momentum tries to capture the rate of change behind it. When the two disagree at a new extreme, it's a signal that the trend's underlying force, the intensity of buying or selling, isn't keeping pace with price, even though price hasn't reversed yet. That's why divergence is often described as an early-warning tool: it can flag fading pressure before it shows up as an actual reversal in price.
The same logic works across virtually any momentum oscillator because they all measure some version of the same thing, the rate or magnitude of recent price change. RSI divergence and MACD divergence get the most attention because those two indicators are the most widely used, but a Stochastic or CCI reading that fails to confirm a new price extreme is describing the identical underlying mismatch.
Limitations and Common Mistakes
- Treating divergence as a timed entry signal, a divergence can persist, or even keep widening, for an extended stretch before price ever turns, especially in strong trends.
- Acting on a single divergence without confirmation, most approaches wait for price itself to show a structural change (like breaking a trendline or prior swing level) before treating the divergence as validated.
- Ignoring the broader trend, divergences that appear against a powerful, established trend resolve into a reversal far less reliably than divergences appearing near known support or resistance.
- Comparing the wrong swing points, divergence only means something when it's measured between two comparable swing highs or two comparable swing lows, not arbitrary points on the chart.
- Assuming every oscillator will show the same divergence at the same time, RSI, MACD, and Stochastic use different calculations and lookback periods, so one may flag a divergence while another doesn't.
Divergence Is a Comparison, Not an Event
Nothing on a chart is inherently divergent. Divergence exists only as a relationship between two chosen swing points on price and the same two on an oscillator, and change either input and the pattern can appear or vanish. That is why RSI can show a divergence the same day MACD does not: different calculations over different lookbacks produce different peaks, and neither is the authoritative version.
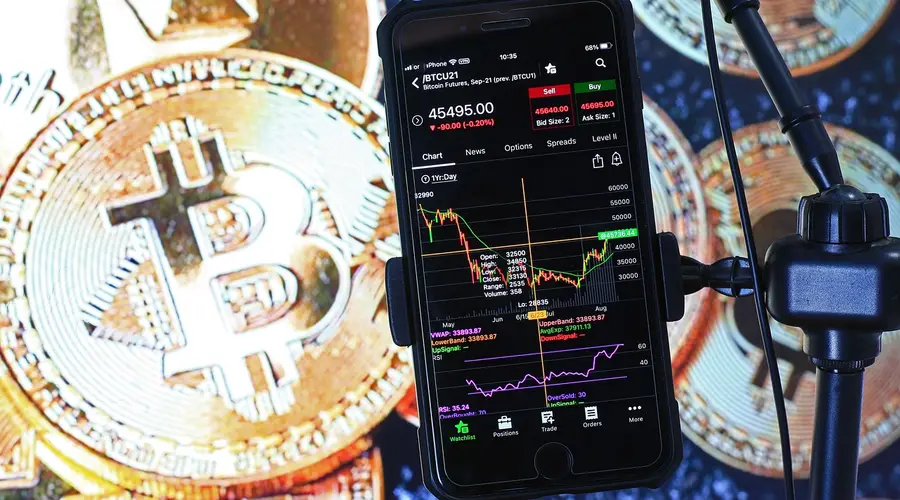
Which leads to the error worth guarding against most carefully. If you cycle through oscillators until one of them confirms the story you already had, you have not found a signal, you have found a tool that agrees with you. Decide which indicator you are reading and which swings you are comparing before you look, and let the answer be no when the comparison does not hold up.
Used properly, divergence adjusts conviction rather than timing. It says the force behind a move is not keeping pace with the move itself, which is a reason to require more from a new entry or to tighten what you will give back on an existing one. It carries no timestamp, and in a powerful trend it can widen for a long stretch without resolving.
Before treating a divergence as validated, most approaches want something from price itself: a broken trendline, a lost prior swing level, a failure to make the next high. Until price does something structural, the disagreement is an observation about an indicator, and the indicator is not what you are trading.
Momentum Divergence FAQs
What is momentum divergence?
Momentum divergence is when price makes a new high or low but a momentum oscillator, RSI, MACD, Stochastic, or similar, fails to confirm it, moving the opposite direction instead. It suggests the buying or selling pressure behind the price move may not support its continuation.
What's the difference between bullish and bearish divergence?
Bearish divergence forms when price makes a higher high but the oscillator makes a lower high, warning that upside momentum is fading. Bullish divergence forms when price makes a lower low but the oscillator makes a higher low, warning that downside momentum is fading.
Is momentum divergence a reliable signal by itself?
No. Divergence describes a mismatch between price and momentum, not a timed entry or exit signal. Many divergences appear well before a reversal, resolve without one, or persist through strong trends, so traders typically treat it as a warning to watch rather than a standalone trigger.
Does momentum divergence only apply to RSI and MACD?
No. Divergence is a general concept that applies to virtually any momentum oscillator, including Stochastic, CCI, and the Rate of Change. RSI divergence and MACD divergence are simply the most commonly discussed indicator-specific forms of the same underlying idea.
How is divergence different from an overbought or oversold reading?
An overbought or oversold reading describes a single oscillator value in isolation. Divergence compares two swing points on both price and the oscillator over time, looking at whether their directions agree, a different, relative comparison rather than an absolute level.
How do you choose which two swings to compare?
This is where most of the subjectivity in divergence analysis lives. The comparison needs two price extremes and their corresponding indicator readings, and nothing in the concept specifies which extremes qualify. A stricter swing rule finds fewer divergences and confirms them later; a looser one finds many, most of which describe minor oscillation. Fixing the swing rule in advance is what makes a divergence claim reproducible.
Can a divergence extend across more than two swings?
Sequences of three or more are described in some sources, usually as a chained comparison where each new extreme continues the pattern. Each additional link relies on the previous swing identification being correct, so the ambiguity compounds. The longer sequences are also rarer, which means less evidence about them, and the extra structure can make a pattern look more established than the underlying comparison supports.
Does the timeframe change whether a divergence exists?
Yes, and this is one of the most common sources of disagreement. Aggregating to a higher timeframe changes which bars are swing extremes and recomputes the indicator on different inputs, so a divergence visible on a four-hour chart can be entirely absent on the daily. Neither chart is wrong. A divergence is a property of a specific series at a specific aggregation, and it should be stated that way.
What ends a divergence?
Either price turns, in which case the comparison is treated as having resolved, or the indicator makes the matching extreme and the divergence condition simply stops being satisfied. The second case gets less attention because nothing dramatic happens: the pattern quietly ceases to exist. Tracking how often divergences dissolve rather than resolve is part of understanding what the observation is worth.
References
Disclaimer
This page is for educational purposes only and does not constitute personalized investment advice, a recommendation to buy or sell any security, or a guarantee of future performance. Momentum divergence describes a relationship between historical price and indicator data; it does not predict outcomes with certainty. Always do your own research and consider consulting a licensed financial professional before making investment decisions.