
Direct Answer
MACD + volume combines the Moving Average Convergence Divergence indicator, which reads trend and momentum from moving averages, with trading volume, which reads how much participation is behind a price move. Traders watch for MACD signal-line crosses or zero-line crosses that coincide with rising, above-average volume, treating that combination as more convincing than a MACD signal on light volume. Volume doesn't change how MACD is calculated, it's read alongside it as an independent confirmation layer.
Key Takeaways
- MACD measures trend and momentum from the relationship between two exponential moving averages; volume measures participation.
- A MACD signal-line crossover on rising volume is generally treated as carrying more conviction than the same crossover on thin volume.
- MACD = 12-period EMA minus 26-period EMA; the signal line is a 9-period EMA of the MACD line.
- A bullish crossover occurs when MACD crosses above the signal line; a bearish crossover occurs when it crosses below.
- Volume is entirely independent of the MACD formula, it adds a separate, non-price-derived data point.
- MACD histogram divergence combined with falling volume is sometimes read as a double signal of fading momentum and participation.
- Both MACD and volume are lagging or coincident measures; neither guarantees future direction.
- The combination is most often discussed on daily or swing-trading timeframes but applies to any chart interval with reliable volume data.
What Is the MACD + Volume Combination?
MACD (Moving Average Convergence Divergence) is a trend-following momentum indicator built from the difference between two exponential moving averages (EMAs) of price. It doesn't incorporate volume at all, it's a pure price-derived indicator. Volume, on the other hand, is a direct count of shares, contracts, or coins traded over a period, entirely independent of price averages. Combining the two means layering a participation check on top of a momentum-crossover signal: does the MACD signal align with the market actually showing up in size, or is it happening on quiet, low-volume trading?
The logic mirrors a broader principle in technical analysis: price and momentum tell you what's happening, while volume tells you how much conviction is behind it. A MACD crossover that occurs alongside a volume spike suggests a broader set of participants moved together to produce that shift. The identical crossover on below-average volume suggests fewer participants were involved, which some traders treat as a weaker or less reliable signal.
How MACD Is Calculated
MACD is built in three parts:
- MACD line = 12-period EMA − 26-period EMA
- Signal line = 9-period EMA of the MACD line
- Histogram = MACD line − Signal line
A bullish signal-line crossover occurs when the MACD line crosses above the signal line; a bearish crossover occurs when it crosses below. A separate "zero-line cross" happens when the MACD line itself crosses above or below zero, indicating the shorter EMA has crossed the longer EMA. Volume is not part of this calculation, it's layered on afterward as a confirmation check, typically compared to a simple moving average of recent volume (e.g., a 20-day average) to judge whether a given day's volume is above or below normal.
Worked Example (Hypothetical)
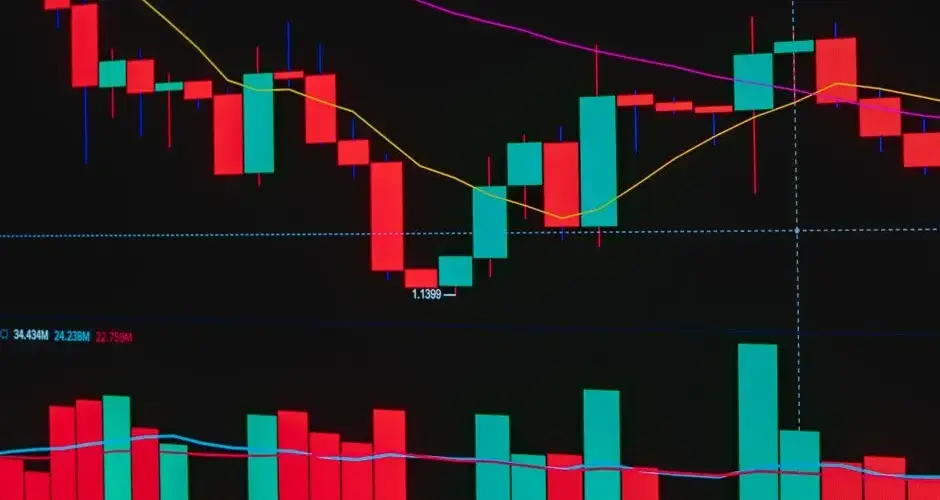
Consider a hypothetical scenario, not real market data. A stock has been drifting sideways for several weeks with average daily volume near 2 million shares. On a given session, the MACD line crosses above the signal line for the first time in over a month, a bullish signal-line crossover, and that day's volume comes in at 5.1 million shares, roughly 2.5 times the recent average. In this hypothetical, the volume spike accompanying the crossover is the kind of confirmation traders describe: momentum turned up, and a notably larger-than-usual number of participants traded on that shift.
Contrast that with a second hypothetical case: the same MACD crossover occurs, but volume that day is only 1.2 million shares, below the 2-million-share average. The MACD signal is technically identical, but with participation running below normal, some traders would treat the signal as less convincing and look for additional confirmation before acting on it.
Why It Matters
MACD alone can generate signal-line crossovers frequently, including in choppy, range-bound conditions where price whips back and forth without a sustained trend developing, a well-documented weakness of moving-average-based indicators. Adding volume as a filter is one way traders try to separate crossovers that reflect a genuine shift in participation from crossovers that are more likely to be noise. Because MACD is derived purely from price averages and volume is derived from an entirely separate data stream (shares or contracts traded), the two don't move in lockstep, which is exactly what makes volume useful as an independent check rather than a redundant one.
This combination is also used in reverse: when a MACD histogram shows the price making a new high or low that the histogram doesn't confirm (histogram divergence), and volume is declining on that latest price extreme, some traders treat the pairing as added evidence that both the momentum and the participation behind a move are fading together.
Limitations and Common Mistakes
- Treating volume confirmation as a guarantee. A high-volume MACD crossover is more convincing than a low-volume one, but it does not guarantee the resulting trend continues.
- Ignoring that MACD is lagging. Because MACD is built from EMAs, its signal-line crosses trail price, the combination doesn't remove that lag, it only adds a filter on top of it.
- Using a stale or inappropriate volume baseline. "High" or "low" volume is relative; comparing a single day's volume without a consistent lookback average (commonly 20 or 50 days) produces inconsistent reads.
- Overfitting to whipsaw markets. In range-bound, low-volatility conditions, MACD can cross frequently even with normal volume, producing signals that aren't actionable regardless of participation.
- Applying the same thresholds across very different instruments. "Above-average volume" on a thinly traded small-cap and a heavily traded large-cap or major crypto asset are not comparable in absolute terms.
- Skipping other confirmation entirely. Many traders treat MACD + volume as one input among several, trendline breaks, support/resistance, or candlestick patterns, rather than a standalone trading rule.
Why This Pairing Is Genuinely Independent
Most indicator pairings are less independent than they look, and this one is an exception worth understanding. Volume is not an input to the MACD formula at any point. MACD reads two exponential averages of price; volume counts how many shares or contracts changed hands. Neither is recoverable from the other, which means a heavy-volume crossover really is two separate observations rather than one restated.
What the pairing does not fix is timing. MACD is built from moving averages and confirms a momentum shift after it has been developing, and adding a volume filter on top makes the signal later, not earlier. If a crossover was arriving after a meaningful part of the move, waiting for volume to confirm it arrives later still. That is a reasonable trade for reliability, provided you know you are making it.
The baseline is where this most often goes wrong in practice. High and low volume mean nothing in absolute terms, so a crossover judged against a single day impression rather than a consistent trailing average produces inconsistent reads across instruments and across time. Fix a lookback, commonly 20 or 50 sessions, and compare against that.
In range-bound conditions the combination inherits MACD core weakness. Crossovers repeat, and volume can be elevated on both sides of a chop for reasons unrelated to direction, so a filter tuned on trending data will pass signals that go nowhere.
Frequently Asked Questions
What is the MACD + volume combination?
MACD + volume pairs the Moving Average Convergence Divergence indicator, which measures trend and momentum, with trading volume, which measures participation. Traders look for MACD signal-line crossovers or zero-line crosses that occur alongside rising volume, treating the volume increase as a sign that more market participants are backing the momentum shift.
How is MACD calculated?
MACD is calculated as the 12-period exponential moving average (EMA) minus the 26-period EMA. A 9-period EMA of that MACD line is plotted alongside it as the signal line, and the difference between the two is often shown as a histogram.
Why add volume to a MACD signal?
MACD is derived entirely from price and says nothing about how many shares or contracts changed hands. Volume adds an independent read on participation, so a MACD crossover accompanied by above-average volume is generally viewed as carrying more conviction than the same crossover on thin volume.
Does a MACD crossover with high volume guarantee a trend will continue?
No. Volume confirmation raises confidence that a momentum shift reflects genuine participation, but it does not guarantee the move continues. MACD is a lagging indicator built from moving averages, and both MACD and volume can give misleading readings in choppy or low-liquidity conditions.
What is MACD histogram divergence with volume?
MACD histogram divergence occurs when price sets a new high or low that the histogram fails to confirm. When that divergence is accompanied by declining volume on the latest price extreme, some traders treat it as an added signal that the move's momentum and participation are both fading together.
Does MACD have to use 12, 26 and 9?
No. Those are the periods Gerald Appel published and the values almost every platform ships as defaults, which is why they dominate. The construction accepts any fast period, slow period and signal period. Changing them changes how often the lines cross and how far the histogram travels, so a MACD signal is only comparable to another when both settings are known.
Should volume be compared to its own average rather than to a fixed number?
To its own recent average, in almost every case. Absolute volume levels differ by orders of magnitude across securities and drift over years for a single one, so a fixed threshold that identifies unusual activity in one name is meaningless in another. Expressing the current figure as a multiple of a trailing average makes the comparison portable, which matters as soon as the same rule is applied across a universe.
Can MACD be calculated on volume instead of price?
Mechanically yes, and the result is a different tool worth understanding before using. A MACD of the volume series describes whether volume is accelerating relative to its own recent trend, which is an observation about participation rather than about price. It should not be read using the interpretations written for price MACD, since crossings and divergences refer to a different quantity.
Why can MACD and volume disagree at a turning point?
Because they are dated differently. Volume is an observation about the bar that just completed, available as soon as it closes. MACD is built from two exponential averages, so it summarises many prior bars and turns after the underlying move has developed. A volume spike can therefore arrive several bars before the MACD acknowledges anything, and the gap is a property of the construction rather than a conflict to resolve.
References
Disclaimer
This page is for educational purposes only and does not constitute investment, financial, or trading advice. Technical indicators like MACD and volume reflect historical price and participation data and do not guarantee future results. Any figures or chart examples on this page are illustrative and hypothetical, not live market data. Swoopr Investment is not a licensed investment advisor; consult a qualified professional before making investment decisions.