
Direct Answer
Confluence refers to multiple independent technical factors, such as a support level, a trendline, and a moving average, aligning at a similar price level, which some technical analysts view as strengthening the significance of that level. The pitfall known as signal stacking is treating indicators that are mathematically derived from the same underlying price data as if they were separate confirming signals, when they may simply be restating the same information in different visual forms.
The distinction matters because the value some analysts place on confluence rests on the idea of independence: several unrelated ways of reading the market pointing to the same price. When the "several" factors are really one factor wearing different indicator skins, that reasoning breaks down, even though the chart can look just as convincing.
Key Takeaways
- Confluence is alignment of independent factors. A support level, a trendline, and a moving average are derived through genuinely different methods, even though all three ultimately reference price.
- Signal stacking is the common pitfall. It happens when multiple indicators built from the same underlying price data are treated as separate confirmations, when they may just be restating one signal.
- Independence is about the calculation, not the appearance. Two indicators can look visually distinct, different colors, different panels, different scales, and still be derived from the same closing prices.
- Momentum oscillators built from the same price series tend to move together. Agreement between them is generally less informative than agreement between factors with genuinely different inputs.
- No universally correct way to weigh technical factors exists. Confluence is a heuristic some analysts use, not a rule with a fixed threshold or a guaranteed outcome.
What Is Confluence in Technical Analysis?
Independent factors aligning at a price level
Confluence refers to multiple independent technical factors, such as a support level, a trendline, and a moving average, aligning at a similar price level, which some technical analysts view as strengthening the significance of that level. Each of those three examples is derived a different way: a support level generally comes from where price has previously reversed or stalled; a trendline is drawn by connecting a series of highs or lows; a moving average is a calculation over a chosen lookback window. When lines drawn or calculated through three different methods happen to land near the same price, some analysts treat that convergence as a reason to pay closer attention to the level, on the reasoning that several unrelated views of the chart are pointing to the same place.
It's worth being precise about what "independent" means here. None of these factors is independent of price itself, they are all, in some sense, derived from the same sequence of trades. What can vary is how independent they are of each other: whether they capture genuinely different information (price structure, time, a different data window, volume) or whether they are just re-expressing the same calculation in a different form.
Signal stacking: the common pitfall
A common pitfall, sometimes called signal stacking, is treating multiple indicators that are mathematically derived from the same underlying price data, and are therefore not truly independent, as if they were separate confirming signals, when they may simply be restating the same information in different visual forms. Momentum oscillators are the clearest example: many are calculated from the same closing prices over similar lookback periods, so when several of them point the same direction at once, that agreement can look like a strong multi-factor confirmation on the chart, even though the underlying calculations are closely related and tend to move together by construction.
This doesn't make any individual indicator wrong or useless. The pitfall is specifically in the counting, treating three closely related readings as three separate pieces of evidence, when they are closer to one piece of evidence shown three times.
Hypothetical Example, For Education Only
The following is an illustrative comparison, not a real security or recommendation.
Setup A, factors that are more independent of each other. A stock has previously found buyers near $48 on three separate occasions over the past year (a support level derived from past price reaction). A line connecting a series of higher lows over recent months also passes through roughly $48 (a trendline derived from price structure over time). The 200-day moving average, a longer-run average of closing prices, currently sits near $48 as well (a moving average derived from a specific calculation window). These three readings come from different methods, historical reaction points, a geometric line through pivot points, and a rolling average, so their alignment near $48 is closer to what "confluence" describes: several different lenses on the chart happening to agree.
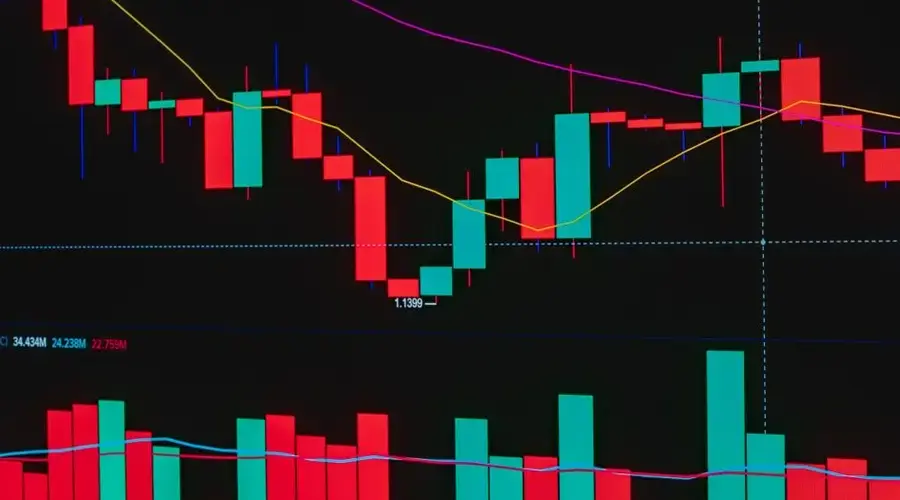
Setup B, signal stacking. The same stock's 14-period RSI, 14-period Stochastic Oscillator, and MACD histogram are all turning up at the same time near $48. All three are calculated from the same 14 (or similar) periods of the same closing prices; momentum oscillators built this way are generally correlated with each other by construction, because they are transformations of the same underlying series rather than separate observations. Three oscillators agreeing here is closer to one momentum reading described three ways than to three independent confirmations, even though the chart shows three lines turning up together.
Note the difference isn't the number of lines on the chart, both setups can show three signals lining up near the same price. The difference is whether those three signals were derived through genuinely different methods (Setup A) or are restatements of the same price calculation (Setup B).
How to Apply This
Ask what each factor is actually calculated from
Before treating agreement between two or more technical readings as meaningful confirmation, it generally helps to ask what data and what calculation produced each one. If two indicators both reduce to a transformation of the same closing prices over a similar window, their agreement is largely expected rather than an independent confirmation.
Look for genuinely different information, not more indicators
Factors that draw on different kinds of information, price structure formed over time (support, trendlines), a different data type entirely (volume), or a materially different calculation window or method, are more likely to add something beyond what a single indicator already shows. Adding another momentum oscillator to a chart that already has two rarely adds new information; it mostly adds another line telling a similar story.
Remember confluence is a heuristic, not a guarantee
There is no universally correct way to weigh technical factors against each other, and no fixed number of aligned factors that makes a level reliable. Confluence is a way some technical analysts think about which levels deserve more attention, not a rule that predicts outcomes. A level with several aligned, independent factors can still fail to hold, just as a level with none can still matter.
Be skeptical of a chart that "looks" heavily confirmed
A chart crowded with indicators can create a visual impression of strong agreement that mostly reflects how many closely related tools were added, rather than how many genuinely different signals are present. Counting the number of lines pointing the same way is a weaker check than asking how many of those lines were derived independently of each other.
Auditing Where Each Factor Came From
Independence is a property of the calculation, not of the appearance. Two readings can sit in different panels, use different colours and different scales, and still both reduce to a transformation of the same closing prices over a similar window. When they agree, that agreement was largely determined before the market opened, and counting it as confirmation inflates conviction without adding information.

The check is mechanical and quick: for each factor, name the data it consumes and the window it consumes it over. A support level formed by price structure months ago, a moving average of recent closes and a round number reflecting where orders cluster draw on genuinely different things. Two oscillators over similar lookbacks do not.
The useful reflex when you want more confirmation is to look for different information rather than more indicators. Volume is not recoverable from price. Structure formed on a higher timeframe is not recoverable from a short-window calculation. Those additions change what you know; a fourth momentum reading does not.
Real confluence still describes agreement among analytical methods rather than an obligation on price. Independent factors aligning at a level makes it a more considered place to be paying attention, and price can travel through it without pausing.
FAQ
What is confluence in technical analysis?
Confluence refers to multiple independent technical factors, such as a support level, a trendline, and a moving average, aligning at a similar price level. Some technical analysts view this alignment as strengthening the significance of that level, on the reasoning that several unrelated ways of reading the chart are pointing to the same price.
What is signal stacking and why is it a pitfall?
Signal stacking is treating multiple indicators that are mathematically derived from the same underlying price data as if they were separate confirming signals, when they may simply be restating the same information in different visual forms. Because the inputs are not truly independent, agreement between them adds less confirmation than it appears to.
How can I tell if two indicators are truly independent?
Check what each indicator is calculated from. If two or more are built from the same closing prices over similar lookback periods, for example several momentum oscillators derived from the same price series, they tend to move together and are not independent, even though they appear as separate lines or panels on a chart. Independence generally comes from using genuinely different information, such as price structure, volume, or a different data source, rather than more indicators.
Does confluence guarantee a level will hold?
No. There is no universally correct way to weigh technical factors, and confluence is a heuristic some analysts use to gauge significance, not a guarantee of outcome. A price level with several aligned factors can still fail, and technical analysis in general does not produce certain forecasts.
Is using several indicators together always a mistake?
No. Combining tools becomes a problem specifically when the tools are not actually independent of each other. Pairing a price-structure observation, such as a support level, with a genuinely different data type, such as volume, is a different exercise than stacking several momentum oscillators that are all derived from the same closing prices.
Can two indicators be redundant even when their formulas are different?
Yes, and this is the usual case. Two indicators computed from the same closing price series share all of their input, so no difference in formula makes them independent observations. Different formulas produce different numbers, which is easy to mistake for different information. The test is what data each one consumes, not what arithmetic it performs on it.
How do you measure whether two signals are redundant?
The direct approach is to correlate their outputs over a long history and look at how often they agree. A stronger version asks whether the second signal changes anything conditional on the first: if the outcomes look the same whether or not the second one fired, it is adding nothing. Both checks require history and a definition of the outcome, which is why the question usually gets answered by eye instead.
Does agreement between price structure and volume count as independent confluence?
It is closer to independent than two price-derived indicators, because volume is a separate data series that is not computed from price. That is a difference in degree rather than a guarantee: volume and price are related, and both respond to the same underlying activity. The comparison is more informative than stacking oscillators, and it is not two unrelated observations.
How many independent factors is enough?
There is no number, and the binding constraint is usually sample size rather than confidence. Each additional requirement reduces how often all of them align, so a demanding confluence rule can produce so few qualifying setups that nothing about it can be evaluated. The practical question is not how many factors would be reassuring, but how many the available history can still support a judgement about.
References
Disclaimer
This article is for educational and informational purposes only and does not constitute personalized investment, financial, or legal advice. Technical analysis concepts described here, including confluence, are commonly used heuristics among some market participants, not rules that predict future price behavior. Trading involves risk, including the possible loss of principal.