
Direct Answer
Price is the most fundamental input to technical analysis, the record of actual transacted prices over time, typically summarized as open, high, low, and close (OHLC) values for each time period. Rather than treating price as one input among many, technical analysis treats it as the primary object of study, because the premise underlying the discipline is that price reflects all available information and market participant behavior at the time of the trade.
This is what separates technical analysis from fundamental analysis. Fundamental analysis focuses on a company's underlying financial and business characteristics, revenue, earnings, margins, balance sheet strength, competitive position, rather than the trading record itself. Technical analysis instead starts from the trading record and works outward, on the premise that the trading record already contains a summary of participant behavior and available information.
Key Takeaways
- Price is a record of actual transactions, not a projection, estimate, or opinion. It is what buyers and sellers actually agreed to trade at during a given period.
- OHLC (open, high, low, close) is the standard summary format for price over a chosen time period, whether that period is one minute or one month.
- Technical analysis treats price as reflecting available information and participant behavior at the time of the trade, this premise is the foundation the rest of the discipline is built on.
- This is the core distinction from fundamental analysis, which studies a company's underlying financial and business characteristics rather than the trading record.
- A single OHLC bar is a summary, not a full transaction log, it compresses an entire period of trading activity into four values.
What Is Price as Market Data?
In technical analysis, "price" refers specifically to the record of actual transacted prices over time, the prices at which real trades occurred, not quoted or theoretical prices. Because a market can generate thousands of individual trades within a single time period, that raw transaction record is generally summarized rather than plotted trade by trade. The standard summary format is OHLC: the open, high, low, and close for each period on a chart.
The open is the first traded price within the period. The close is the last traded price within the period. The high and low are the highest and lowest prices reached at any point during the period. Together, these four values describe both the range of trading activity (from the low to the high) and its net direction (from the open to the close) without requiring every individual transaction to be recorded.
This summarized price record is what candlestick charts, bar charts, and line charts are all built from, a line chart typically plots only the close of each period, while candlestick and bar charts display all four OHLC values so the full range of a period's trading activity is visible.
Technical analysis is built on the premise that price reflects all available information and market participant behavior at the time of the trade. In practice. This means the discipline treats the trading record itself, not company filings, industry data, or macroeconomic releases, as the primary object worth studying, since price is understood as the point where all such information and behavior converges into an actual transaction.
This is what distinguishes technical analysis from fundamental analysis. Fundamental analysis focuses on a company's underlying financial and business characteristics, its revenue, earnings, balance sheet, competitive position, and other business fundamentals, rather than the trading record itself. The two approaches can be used separately or together, but they start from different objects of study: one starts from the business, the other starts from the trade.
Hypothetical Example, For Education Only
Consider a single trading day for a hypothetical stock. Over the course of the day, thousands of individual trades occur as the price moves around in response to buying and selling activity. Rather than record every trade, a daily OHLC bar summarizes the entire day in four numbers:

| OHLC value | Hypothetical price | What it represents |
|---|---|---|
| Open | $50.00 | First traded price of the day |
| High | $51.50 | Highest traded price of the day |
| Low | $49.25 | Lowest traded price of the day |
| Close | $51.00 | Last traded price of the day |
From these four numbers alone, several things can be read off directly. The day's range was $2.25 (the $51.50 high minus the $49.25 low). The stock finished the day up $1.00 from where it opened ($51.00 close minus $50.00 open), a net gain of 2% on the opening price. The close ($51.00) sitting near the high ($51.50) rather than the low ($49.25) is generally read as a sign that buying activity was relatively strong late in the session, though the bar alone does not reveal exactly when during the day the high, low, open, and close occurred relative to one another.
What this single bar does not tell you is how many total shares traded, whether the move happened gradually or in a few large trades, or what news or information, if any, was behind the activity. That is why OHLC data is commonly viewed alongside volume and across a sequence of periods, rather than read from one isolated bar.
Limitations and Common Mistakes
Treating a single OHLC bar as a complete story
An OHLC bar is a summary of a period, not a transcript of it. Two periods with identical open, high, low, and close values can reflect very different underlying trading activity, one might involve a steady, orderly progression of trades, while the other might involve a sharp spike followed by a reversal back near the open. Reading meaning into a single bar in isolation, without the context of surrounding bars and volume, risks over-interpreting what the summary actually captures.
Choosing a time period without considering what it hides
OHLC data can be summarized over any period, minutes, hours, days, weeks, or months, and the same underlying trading activity looks different depending on the period chosen. A daily bar smooths over everything that happened within the day; a monthly bar smooths over everything that happened within the month. There is no universally correct time period for every purpose; the appropriate period generally depends on the trading or analysis horizon being used.
Confusing price data with the reasons behind it
Price data records that a trade happened at a certain level, not why it happened. Technical analysis works from the premise that price reflects available information and participant behavior, but the price record itself does not label which piece of information or which participants were responsible for a given move. Attributing a specific cause to a price move based on the OHLC record alone, without other corroborating evidence, is a common overreach.
Substituting price data for company fundamentals when the question calls for it
Because technical analysis is built entirely on the trading record, it does not by itself address questions about a company's underlying financial and business characteristics, questions that fundamental analysis is built to address. Using price data alone to answer a question that depends on earnings quality, balance sheet strength, or competitive position conflates two distinct and generally complementary approaches.
The Premise Underneath Everything Else
Technical analysis rests on a stated assumption: that price reflects the available information and participant behaviour at the moment of the trade. That is a premise, not a demonstrated fact, and it is worth naming clearly because everything built on top of it inherits whatever the premise does not cover. Where it holds well, price-derived tools are working with a rich summary. Where information has not reached the market yet, price is summarising a state of knowledge rather than a state of the world.
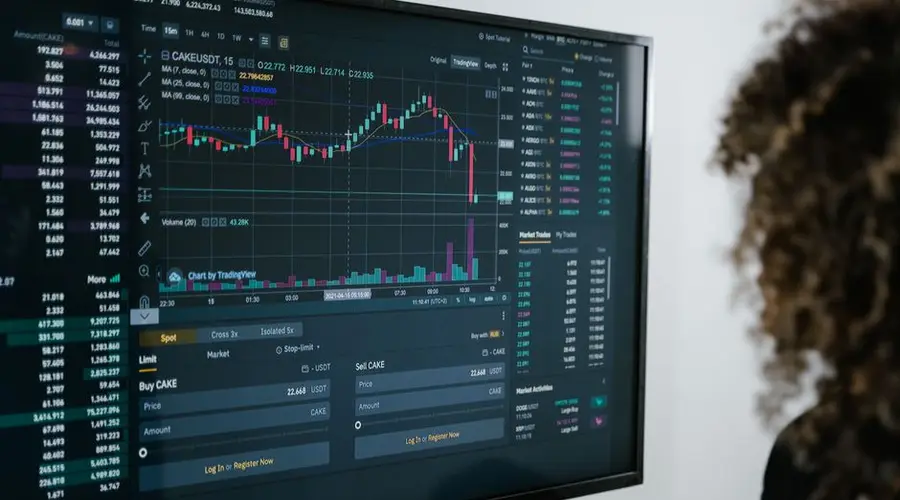
What price genuinely is remains solid ground. It is a record of transactions that occurred, not an estimate or a projection, and the OHLC summary compresses a period of those transactions into four numbers. Those four are facts; the interpretation placed on them is not.
The compression itself deserves attention. An open, high, low and close describe the boundaries of a period and say nothing about the path taken between them, so two very different sessions can produce identical values. Whatever timeframe you work on, you are reading a summary whose resolution you chose.
And treating price as the primary object of study is a deliberate scope decision rather than a claim that other information is irrelevant. It defines what the discipline looks at, which also defines what it cannot see.
FAQ
What is price data in technical analysis?
Price data is the record of actual transacted prices over time, typically summarized as open, high, low, and close (OHLC) values for each time period. It is the most fundamental input to technical analysis, every chart, indicator, and pattern is built from this record of what actually traded, not from projections or opinions about what should trade.
What do open, high, low, and close mean?
For a given time period, the open is the first traded price, the close is the last traded price, the high is the highest price reached, and the low is the lowest price reached during that period. Together these four values summarize the full range and direction of trading activity within the period without recording every individual transaction.
How is price data different from fundamental analysis?
Technical analysis is built on the premise that price reflects all available information and market participant behavior at the time of the trade, so the trading record itself is the object of study. Fundamental analysis instead focuses on a company's underlying financial and business characteristics, earnings, revenue, balance sheet strength, competitive position, rather than the trading record.
Why is the closing price often given more weight than the open, high, or low?
The close represents the last price agreed upon by buyers and sellers before the period ends, commonly treated as a settled consensus value for that period. Many indicators and chart types are calculated primarily from closing prices for this reason, though the open, high, and low still carry information about the range and direction of trading within the period.
Does a single OHLC bar tell you everything about a trading period?
No. OHLC values are a summary, not a complete transaction log, they compress an entire period of trading activity, which could include thousands of individual trades, into four numbers. Two periods with identical OHLC values can have very different underlying trading activity, which is one reason OHLC data is generally paired with volume and viewed across multiple periods rather than read in isolation.
What time periods can OHLC price data be summarized over?
OHLC data can be summarized over essentially any time period a chart uses, from one-minute or five-minute intraday bars to daily, weekly, or monthly bars. The underlying transacted prices are the same; only the length of the period being summarized changes, which is why the same price history can look different depending on the chart's chosen time frame.
What does a daily closing price actually represent?
In most equity markets it is the price of the closing auction, a single crossing that concentrates a large share of the day orders, rather than the last continuous trade. For markets that trade around the clock there is no natural close at all, so the value is whatever price prevailed at a cutoff the venue or the data vendor chose. Two vendors using different cutoffs report different closes for the same day.
Why do two data vendors report different highs and lows for the same day?
Because they cover different venues and apply different inclusion rules. Whether odd lots, off-exchange prints and trades reported late are counted changes the extremes, and equity trading is spread across many venues. The differences are usually small and they are not random: they concentrate in exactly the fast-moving sessions where an extreme is most likely to matter to a rule that references it.
What is a settlement price and how does it differ from a close?
In futures markets the settlement price is a value calculated by the exchange for margining purposes, frequently as an average over a defined window near the end of the session rather than as the last traded price. It is the number positions are marked against, so it is the relevant one for a holder, and it can differ from the final print. Charting packages vary in which one they display.
References
Disclaimer
This article is for educational and informational purposes only and does not constitute personalized investment, financial, or legal advice. Technical analysis is one approach among several ways of studying markets, and no method guarantees a particular outcome. Trading involves risk, including the possible loss of principal.