
Direct Answer
Market structure, in a technical-analysis context, refers to the sequence of swing highs and swing lows that define a security's price pattern over time. An uptrend is commonly characterized by a series of higher highs and higher lows, a downtrend by lower highs and lower lows, and a range or consolidation by highs and lows that stay within a relatively stable band. Recognizing market structure is foundational to identifying trend direction, trend changes, and key support and resistance levels, many analysts view it as the underlying price behavior that other technical tools are commonly built on top of.
Key Takeaways
- Structure is defined by swing points, not price alone. A single high or low means little; it is the sequence of successive swing highs and swing lows that reveals whether a security is trending or ranging.
- Uptrends: higher highs and higher lows. Each new swing peak forms above the prior swing peak, and each new swing trough forms above the prior swing trough.
- Downtrends: lower highs and lower lows. The mirror image of an uptrend, each new swing peak and swing trough forms below the one before it.
- Ranges: highs and lows within a relatively stable band. Neither the swing highs nor the swing lows are consistently advancing or declining.
- Structure underlies support and resistance. Prior swing lows are commonly treated as support; prior swing highs are commonly treated as resistance.
- Identifying swing points is a judgment call, not a fixed rule. There is no single universally correct method, fixed-bar lookbacks, percentage retracements, and fractal patterns are all commonly used, generally with different sensitivity-versus-noise trade-offs.
What Is Market Structure?
Market structure, in a technical-analysis context, refers to the sequence of swing highs and swing lows that define a security's price pattern over time. Rather than looking at price in isolation at any single moment, market structure asks a sequential question: as price moves from one turning point to the next, is each new peak and trough forming above, below, or roughly in line with the one before it? The answer to that question is what technical analysts use to classify the prevailing trend.
Swing Highs and Swing Lows
A swing high is generally a local peak in price, a point with lower prices on either side of it on the chart. A swing low is the mirror concept: a local trough with higher prices on either side. These turning points are the raw material of market structure; everything else in this framework is built from reading the sequence they form.
Uptrends: Higher Highs and Higher Lows
An uptrend is commonly characterized by a series of higher highs and higher lows. Each successive swing high prints above the prior swing high, and each successive swing low prints above the prior swing low. This pattern reflects buyers generally stepping in before price retraces all the way back to the previous low, and then pushing price to a new high before pulling back again.
Downtrends: Lower Highs and Lower Lows
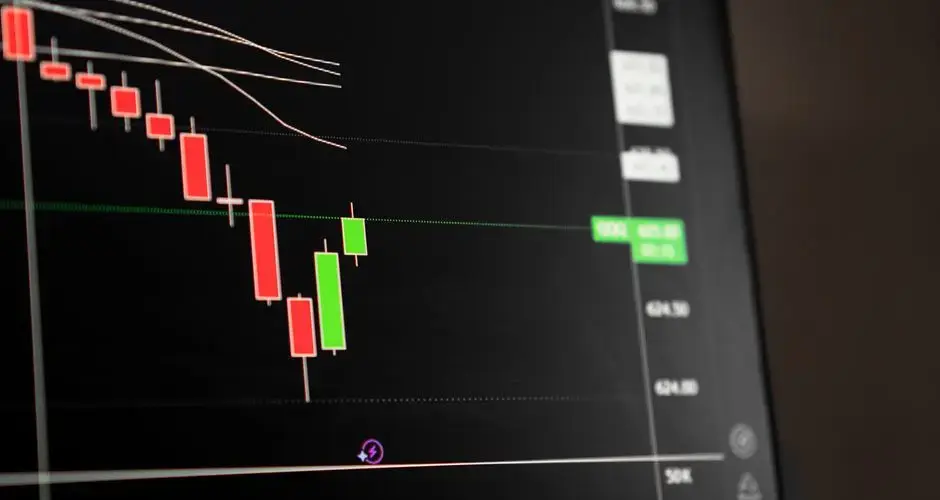
A downtrend is the inverse: a series of lower highs and lower lows. Each successive swing high forms below the prior swing high, and each successive swing low forms below the prior swing low. This reflects sellers generally capping rallies below the previous peak and pushing price to fresh lows on each subsequent decline.
Ranges: A Relatively Stable Band
A range, or consolidation, is what happens when neither pattern holds, highs and lows stay within a relatively stable band rather than consistently advancing or declining. Swing highs cluster near a similar ceiling and swing lows cluster near a similar floor, without either boundary being decisively broken over the period being examined.
Hypothetical Example, For Education Only
Suppose a stock trades through the following sequence of swing points over several weeks: a swing high at $55, a swing low at $52, a new swing high at $58, and a new swing low at $54. Comparing each turning point to the one before it: $58 is above the prior swing high of $55 (a higher high), and $54 is above the prior swing low of $52 (a higher low). That combination, higher high followed by higher low, is the textbook signature of an uptrend under this framework.

Now suppose price advances to a new swing high of $61, then declines and forms a swing low at $50, below the prior swing low of $54. That $50 print breaks the established pattern of higher lows. Technical analysts commonly refer to this as a break of structure: the sequence that had been defining the uptrend no longer holds. A single break of structure does not, by itself, prove the uptrend is over, price could still recover and resume printing higher lows, but it is generally treated as an early signal that the prevailing trend may be losing momentum or reversing, and it is often a point where analysts pay closer attention to how price behaves next.
How to Apply This
Applying market structure well is less about a formula and more about consistency, the same swing-identification method, the same timeframe, and the same level of context applied every time a chart is read. A few points are generally worth keeping in mind:
- There is no universally correct way to define a swing point. Fixed-bar lookbacks (comparing a bar to a set number of bars on either side), minimum percentage retracements, and fractal-pattern definitions built into charting software are all commonly used. Each involves a trade-off: tighter definitions catch more, smaller swings but generate more noise; looser definitions filter noise but react more slowly to genuine changes in trend.
- Timeframe consistency matters. A security can show an uptrend structure on a daily chart while showing a downtrend or range structure on an hourly chart at the same moment. Neither reading is "wrong", they describe different timeframes, but mixing timeframes without being explicit about which one is being analyzed is a common source of confusion.
- One new high or low is not a trend change. A break of structure is generally treated as a signal worth watching, not a conclusion on its own. Waiting for the sequence to establish itself, for example, a subsequent swing point that confirms the new pattern, is a common way analysts avoid reacting to noise.
- A range is not a failed trend read. Consolidation is a legitimate structure in its own right, not a gap in the framework. Treating a genuine range as an ambiguous or indecisive uptrend/downtrend call is a common mistake.
- Structure is a foundation, not a complete system. It is commonly combined with other tools, indicators, volume, or a defined risk-management process, rather than used as the sole basis for a trading decision.
Read the Structure Before the Indicators
Market structure is the thing indicators are describing, which makes it the sensible place to start rather than a topic to cover after the tools. A moving average sloping upward, a positive trend-strength reading and an intact rising trendline are three summaries of the same underlying fact: swing highs and swing lows have been progressing upward. Reading the sequence directly gets you the fact; reading the indicators gets you three lagged accounts of it.

The sequence is also what gives you a falsification condition. An uptrend defined by higher highs and higher lows ends when a pullback fails to hold above the prior low, and that price is identifiable while the trend is still healthy. No indicator provides an equivalent line in advance.
The soft edge is which pivots count as swing points, and that is a judgment. Different people mark different highs and lows on the same chart, which is why writing down what qualifies, even loosely, matters more for consistency with yourself over time than for agreeing with anyone else.
And a single high or low tells you almost nothing. Structure is a statement about a sequence, so one new low inside an uptrend is a data point, and the question is always whether the pattern of successive swings has changed.
FAQ
What is market structure in technical analysis?
Market structure refers to the sequence of swing highs and swing lows that define a security's price pattern over time. An uptrend is commonly characterized by a series of higher highs and higher lows, a downtrend by lower highs and lower lows, and a range or consolidation by highs and lows that stay within a relatively stable band. Recognizing this sequence is foundational to identifying trend direction, trend changes, and key support and resistance levels.
How do you identify a swing high or swing low?
A swing high is generally a price peak with lower prices on both sides of it; a swing low is a price trough with higher prices on both sides of it. There is no single universally correct method for pinpointing them, traders commonly use a fixed number of bars on either side, a minimum percentage retracement, or charting-software fractal patterns. Each approach trades off sensitivity (catching more, smaller swings) against noise (filtering out minor fluctuations), so the choice generally depends on the timeframe and instrument being analyzed.
What is the difference between an uptrend and a downtrend in terms of market structure?
An uptrend is commonly characterized by a series of higher highs and higher lows, each swing peak and each swing trough forms above the prior one. A downtrend is the mirror image: a series of lower highs and lower lows, where each swing peak and each swing trough forms below the prior one. When price instead oscillates between highs and lows that stay within a relatively stable band. That is generally described as a range or consolidation rather than a trend.
What does a break of structure mean?
A break of structure generally refers to a swing point forming in a way that violates the prevailing sequence, for example, an uptrend printing a lower low instead of the expected higher low, or a downtrend printing a higher high instead of the expected lower high. Technical analysts commonly treat this as an early signal that the existing trend may be losing momentum or reversing, though a single break is not on its own proof that the trend has changed, since price can also resume the prior sequence afterward.
How does market structure relate to support and resistance?
Swing highs and swing lows are the price levels technical analysts commonly use to draw support and resistance. A prior swing low that has held more than once is commonly treated as a support level; a prior swing high that has capped price more than once is commonly treated as a resistance level. Because these levels are derived directly from the swing-high/swing-low sequence, market structure and support/resistance analysis are generally viewed as two views of the same underlying price behavior rather than separate techniques.
Is market structure analysis reliable on its own?
Market structure is a foundational framework, not a standalone signal, and there is no universally correct way to apply it in isolation. Swing points can be identified differently depending on the method and timeframe used, and a structure reading on one timeframe can conflict with a reading on another. Technical analysts commonly combine market structure with other tools, indicators, volume, or a defined risk-management process, rather than treating a single higher high or lower low as a trade decision by itself.
What is a change of character, and how does it differ from a break of structure?
A break of structure is a move beyond the last swing point in the direction the sequence was already going, so it continues the existing read. A change of character is the first break against that sequence, which is where the structural label comes into question. Terminology varies between sources and neither term has a formal definition, so both should be accompanied by the swing rule that produced them.
Does market structure need a minimum swing size?
Without one, very small reversals qualify as swing points and the structural label flips constantly, which makes the reading unusable. Adding a minimum size, expressed in percent or in volatility units, stabilises it at the cost of confirming each point later. The threshold is a parameter, and two analysts using different thresholds will disagree about the trend on identical data without either being careless.
Should market structure be read from wicks or from closes?
Both conventions are in use and they disagree exactly at the marginal cases. Wick-based structure treats any penetration of the prior extreme as a break, so it registers more breaks including ones that reversed immediately. Close-based structure requires the period to finish beyond the level, so it registers fewer and later. The choice should be fixed in advance, since deciding case by case is how a structural read becomes unfalsifiable.
References
Disclaimer
This article is for educational and informational purposes only and does not constitute personalized investment, financial, or legal advice. Technical analysis methods, including market structure. Do not guarantee future results, and there is no universally correct way to apply this framework. Trading involves risk, including the possible loss of principal.