
Direct Answer
SEC EDGAR classifies Wabtec under SIC major group 37. Among Swoopr's S&P 500 Equal Weight companies, 71 others share that classification; by latest reported revenue, Wabtec ranks 15 of 72. A filing classification is a starting point: a company's real competitors depend on its segments, which its 10-K describes.
How Does Wabtec Compare With Its Peers?
| Company | Revenue (latest FY) | Revenue growth | Operating margin | Net margin |
|---|---|---|---|---|
| Ford Motor Company (F) | $187 billion FY2025 | 1.2% | -4.9% | -4.4% |
| General Motors (GM) | $185 billion FY2025 | -1.3% | 1.6% | 1.5% |
| Tesla (TSLA) | $94.8 billion FY2025 | -2.9% | 4.6% | 4.0% |
| Boeing (BA) | $89.5 billion FY2025 | 34.5% | 4.8% | 2.5% |
| RTX Corporation (RTX) | $88.6 billion FY2025 | 9.7% | 10.5% | 7.6% |
| Lockheed Martin (LMT) | $75.0 billion FY2025 | 5.6% | 10.3% | 6.7% |
| General Dynamics (GD) | $52.5 billion FY2025 | 10.1% | 10.2% | 8.0% |
| Honeywell Technologies (HON) | $37.4 billion FY2025 | 7.8% | 21.7% | 12.6% |
| Paccar (PCAR) | $28.4 billion FY2025 | -15.5% | n/a | 8.4% |
| Lear Corporation (LEA) | $23.3 billion FY2025 | -0.2% | 3.3% | 1.9% |
| Aptiv (APTV) | $20.4 billion FY2025 | 3.5% | 5.8% | 0.8% |
| Textron (TXT) | $14.8 billion FY2025 | 8.0% | n/a | 6.2% |
| BorgWarner Inc. (BWA) | $14.3 billion FY2025 | 1.6% | 3.7% | 1.9% |
| Huntington Ingalls Industries (HII) | $12.5 billion FY2025 | 8.2% | 5.3% | 4.8% |
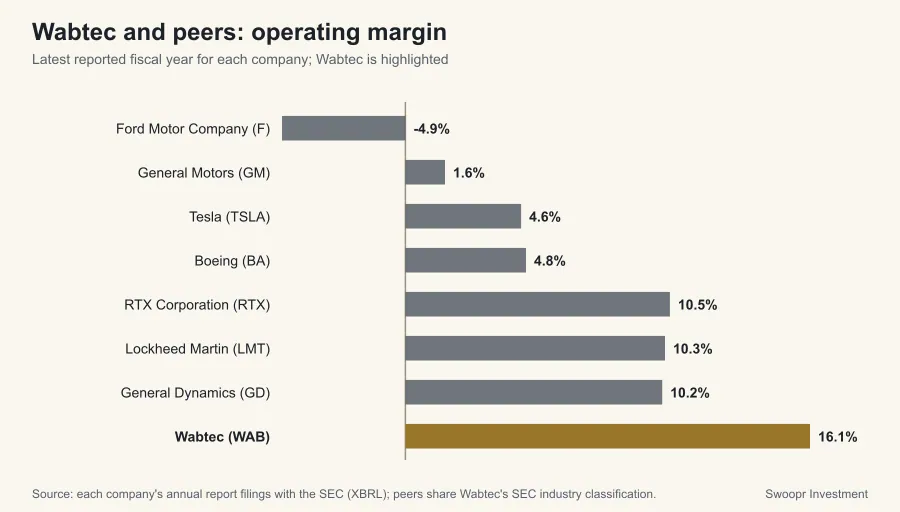
| Wabtec (WAB) | $11.2 billion FY2025 | 7.5% | 16.1% | 10.5% |
| Oshkosh Corporation (Holding Company)Common Stock (OSK) | $10.4 billion FY2025 | -2.9% | 9.0% | 6.2% |
| Thor Industries Inc. (THO) | $9.6 billion FY2025 | -4.6% | n/a | 2.7% |
| TransDigm Group (TDG) | $8.8 billion FY2025 | 11.2% | 47.2% | 23.5% |
| Dana Incorporated (DAN) | $7.5 billion FY2025 | -3.0% | 1.9% | 1.1% |
| Polaris Inc. (PII) | $7.2 billion FY2025 | -0.3% | -4.9% | -6.5% |
| StandardAero Inc. (SARO) | $6.1 billion FY2025 | 15.8% | 9.1% | 4.6% |
| Rivian Automotive Inc. (RIVN) | $5.4 billion FY2025 | 8.4% | -66.5% | -67.7% |
| Heico Corporation (HEI) | $4.5 billion FY2025 | 16.3% | 22.7% | 15.4% |
| Harley-Davidson Inc. (HOG) | $4.5 billion FY2025 | -13.8% | 8.6% | 7.6% |
| LCI Industries (LCII) | $4.1 billion FY2025 | 10.2% | 6.8% | 4.6% |
| Visteon Corporation (VC) | $3.8 billion FY2025 | -2.5% | n/a | 0.0% |
| Modine Manufacturing Company (MOD) | $3.2 billion FY2026 | 23.1% | 10.8% | 3.8% |
| Allison Transmission Holdings Inc. (ALSN) | $3.0 billion FY2025 | -6.7% | 29.2% | 20.7% |
| Cooper-Standard Holdings Inc. (CPS) | $2.7 billion FY2025 | 0.4% | 3.2% | -0.2% |
| Gentex Corporation (GNTX) | $2.5 billion FY2025 | 9.6% | 18.7% | 15.2% |
| AeroVironment Inc. (AVAV) | $2.0 billion FY2026 | 140.9% | -15.7% | -13.4% |
| Wabash National Corporation (WNC) | $1.5 billion FY2025 | -20.8% | 19.9% | 13.7% |
| Blue Bird Corporation (BLBD) | $1.5 billion FY2025 | 9.9% | 11.3% | 8.6% |
| Lucid Group Inc. (LCID) | $1.4 billion FY2025 | 67.6% | -258.7% | -199.3% |
| Kratos Defense & Security Solutions Inc. (KTOS) | $1.3 billion FY2025 | 18.5% | 1.9% | 1.6% |
| Astronics Corporation (ATRO) | $862 million FY2025 | 8.4% | 8.9% | 3.4% |
| Stoneridge Inc. (SRI) | $861 million FY2025 | -5.2% | -4.5% | -11.9% |
| Ducommun Incorporated (DCO) | $825 million FY2025 | 4.9% | -4.3% | -4.5% |
| Malibu Boats Inc. (MBUU) | $808 million FY2025 | -2.6% | 2.7% | 1.9% |
| Miller Industries Inc. (MLR) | $790 million FY2025 | -37.2% | n/a | 2.9% |
| Motorcar Parts of America Inc. (MPAA) | $790 million FY2026 | 4.3% | 8.3% | 1.5% |
| Commercial Vehicle Group Inc. (CVGI) | $649 million FY2025 | -10.3% | -0.1% | -3.2% |
| Holley Inc. (HLLY) | $614 million FY2025 | 1.9% | 13.4% | 3.1% |
| Rocket Lab (RKLB) | $602 million FY2025 | 38.0% | -38.0% | -32.9% |
| STRATTEC SECURITY CORPORATION (STRT) | $579 million FY2026 | 2.5% | 4.6% | 3.6% |
| FreightCar America Inc. (RAIL) | $501 million FY2025 | -10.4% | 6.8% | 7.6% |
| Loar Holdings Inc. (LOAR) | $496 million FY2025 | 23.2% | 21.4% | 0.0% |
| Redwire Corporation (RDW) | $335 million FY2025 | 10.3% | -68.5% | -67.6% |
| MasterCraft Boat Holdings Inc. (MCFT) | $284 million FY2025 | -11.8% | 4.0% | 2.5% |
| Voyager Technologies Inc. (VOYG) | $166 million FY2025 | 15.4% | -65.2% | -63.0% |
| Firefly Aerospace Inc. (FLY) | $160 million FY2025 | 163.0% | -163.1% | -186.6% |
| AIRO Group Holdings Inc. (AIRO) | $91 million FY2025 | 4.6% | -31.6% | -4.5% |
| SIFCO Industries Inc. (SIF) | $85 million FY2025 | 6.5% | 0.2% | -0.9% |
| Park Aerospace Corp. (PKE) | $73 million FY2026 | 18.2% | 18.4% | 0.0% |
| Massimo Group (MAMO) | $72 million FY2025 | 3680.4% | 2.8% | 2.1% |
| CPI Aerostructures Inc. (CVU) | $69 million FY2025 | -14.6% | -0.3% | -1.2% |
| Joby Aviation Inc. (JOBY) | $53 million FY2025 | 39183.1% | -1346.9% | -1740.5% |
| Air Industries Group (AIRI) | $48 million FY2025 | -13.0% | -0.7% | -2.7% |
| Xos Inc. (XOS) | $46 million FY2025 | -17.8% | -71.9% | -0.0% |
| Beta Technologies Inc. (BETA) | $36 million FY2025 | 136.0% | -1046.3% | -2094.2% |
| LiveWire Group Inc. (LVWR) | $26 million FY2025 | -3.6% | -294.0% | -292.6% |
| Workhorse Group Inc. (WKHS) | $21 million FY2025 | 201.1% | -223.7% | -302.2% |
| Fly-E Group Inc. (FLYE) | $19 million FY2026 | -25.0% | -33.8% | -48.6% |
| Aeva Technologies Inc. (AEVA) | $18 million FY2025 | 99.4% | -705.8% | -802.0% |
| Twin Vee PowerCats Co. (VEEE) | $15 million FY2025 | 3.0% | -59.3% | -58.1% |
| AgEagle Aerial Systems Inc. (UAVS) | $13 million FY2025 | -4.3% | -115.0% | -41.2% |
| Azio AI Holdings Inc. (AZIO) | $6 million FY2025 | 217.6% | -651.3% | -658.8% |
| Hyliion Holdings Corp. (HYLN) | $3 million FY2025 | 130.3% | -1886.4% | -1645.7% |
| Momentus Inc. (MNTS) | $1 million FY2025 | -47.5% | -2455.4% | -2682.7% |
| Faraday Future Intelligent Electric Inc. (FFAI) | $536,000 FY2025 | -0.6% | -61763.1% | -74082.5% |
| Archer Aviation Inc. (ACHR) | $300,000 FY2025 | n/a | -243100.0% | -206066.7% |
| AEye Inc. (LIDR) | $233,000 FY2025 | 15.3% | -13618.5% | -14574.2% |
Revenue growth compares each company's latest fiscal year with the one before. Fiscal years do not always end on the same date, so treat close comparisons with care.
Where These Numbers Come From
Every figure on this page is a value Wabtec reported in its own SEC filings, read from the SEC's XBRL data (accession 0001628280-26-008067 for fiscal year 2025). Ratios are computed from those reported values. Figures were retrieved on October 7, 2026; a later amendment or a new annual report can change them, and the filing itself always takes precedence over this summary.
Each fiscal year is labeled by the calendar year in which it ended, so a company that names the same period differently in its own filings (many retailers whose year ends in January) may use another label. A year is left out of the table when the SEC data set holds no value for it. A figure shown as "Not reported" means the company did not file a value under the standard tag Swoopr reads, not that the amount was zero. This page is educational and describes reported history only; it is not a forecast or a recommendation.
Frequently Asked Questions
Who are Wabtec's competitors?
Companies sharing Wabtec's SEC classification (SIC major group 37) include Ford Motor Company (F), General Motors (GM), Tesla (TSLA), Boeing (BA), RTX Corporation (RTX). Its 10-K names the competitors it considers most relevant.
How does Wabtec compare with its peers on margins?
Wabtec's fiscal 2025 operating margin was 16.1%, against a peer median of 1.9%.
How are these peers chosen?
By the SEC Standard Industrial Classification code each company files under, within Swoopr's S&P 500 Equal Weight company set, falling back to the two-digit major group when fewer than two companies share the exact code. Classification codes are broad, so read the peer list as a screen, not a verdict.