
What Are Q32 Bio Inc.'s Key Financial Figures?
| Fiscal year | FY2025 ended December 31, 2025 | FY2024 ended December 31, 2024 | FY2023 ended December 31, 2023 | FY2022 ended December 31, 2022 |
|---|---|---|---|---|
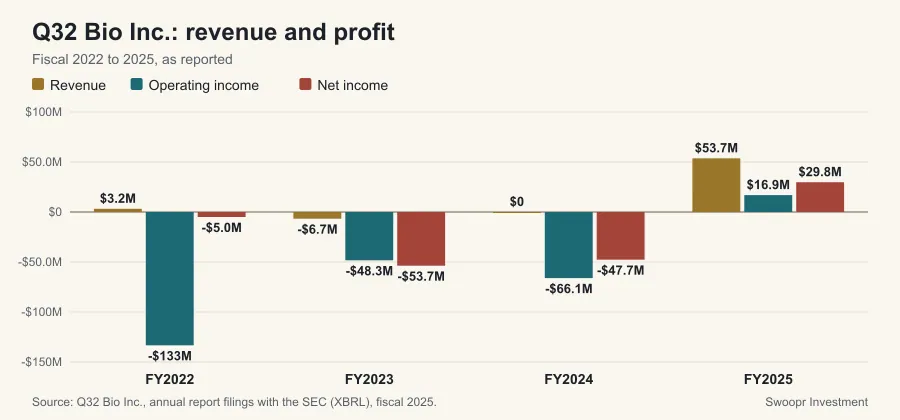
| Revenue | $54 million | $0 | -$7 million | $3 million |
| Operating income | $17 million | -$66 million | -$48 million | -$133 million |
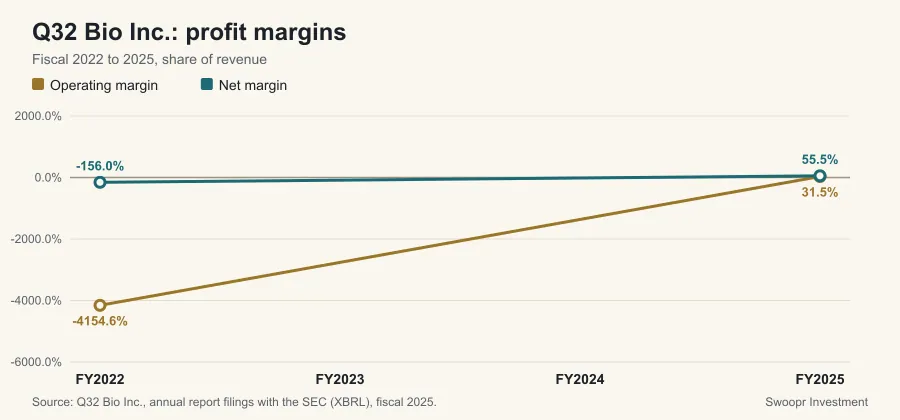
| Operating margin | 31.5% | n/a | n/a | -4154.6% |
| Net income | $30 million | -$48 million | -$54 million | -$5 million |
| Net margin | 55.5% | n/a | n/a | -156.0% |
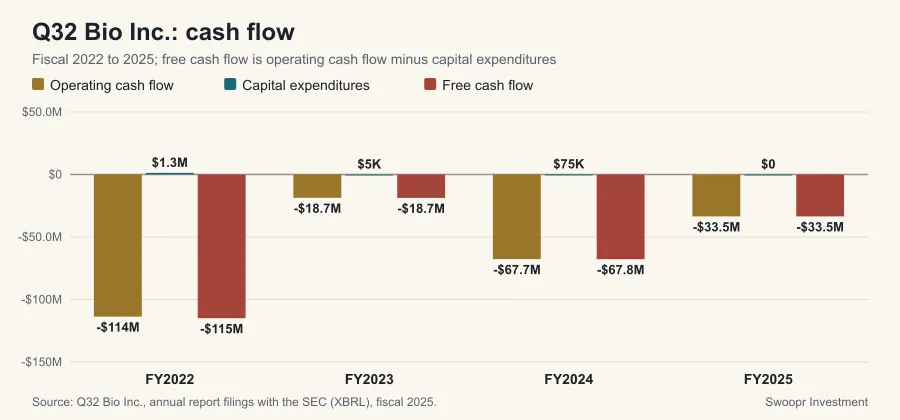
| Operating cash flow | -$34 million | -$68 million | -$19 million | -$114 million |
| Capital expenditures | $0 | $75,000 | $5,000 | $1 million |
| Free cash flow | -$34 million | -$68 million | -$19 million | -$115 million |
Free cash flow (operating cash flow minus capital expenditures) was -$34 million against net income of $30 million; cash generation fell short of reported earnings, which is worth reconciling in the cash flow statement.
What Does Q32 Bio Inc.'s Balance Sheet Show?
| Cash and cash equivalents | $48 million |
|---|---|
| Long-term debt | Not reported |
| Total assets | $62 million |
| Total liabilities | $20 million |
| Shareholders' equity | $42 million |
| Current ratio | 4.9x |
Balance sheet values are as of the end of fiscal 2025. Income statement figures describe a whole year; balance sheet figures describe a single day, so the two answer different questions.
Where These Numbers Come From
Every figure on this page is a value Q32 Bio Inc. reported in its own SEC filings, read from the SEC's XBRL data (accession 0001193125-26-099339 for fiscal year 2025). Ratios are computed from those reported values. Figures were retrieved on October 7, 2026; a later amendment or a new annual report can change them, and the filing itself always takes precedence over this summary.
Each fiscal year is labeled by the calendar year in which it ended, so a company that names the same period differently in its own filings (many retailers whose year ends in January) may use another label. A year is left out of the table when the SEC data set holds no value for it. A figure shown as "Not reported" means the company did not file a value under the standard tag Swoopr reads, not that the amount was zero. This page is educational and describes reported history only; it is not a forecast or a recommendation.
Frequently Asked Questions
What was Q32 Bio Inc.'s revenue in fiscal 2025?
Q32 Bio Inc. reported revenue of $54 million for the fiscal year ended December 31, 2025, according to its SEC filings.
What is Q32 Bio Inc.'s operating margin?
Q32 Bio Inc.'s operating margin was 31.5% in fiscal 2025: operating income of $17 million on revenue of $54 million.
How much free cash flow did Q32 Bio Inc. generate?
Operating cash flow of -$34 million less capital expenditures of $0 gives free cash flow of -$34 million for fiscal 2025.