
Direct Answer
SEC EDGAR classifies Pentair under SIC major group 35. Among Swoopr's S&P 500 Equal Weight companies, 110 others share that classification; by latest reported revenue, Pentair ranks 40 of 111. A filing classification is a starting point: a company's real competitors depend on its segments, which its 10-K describes.
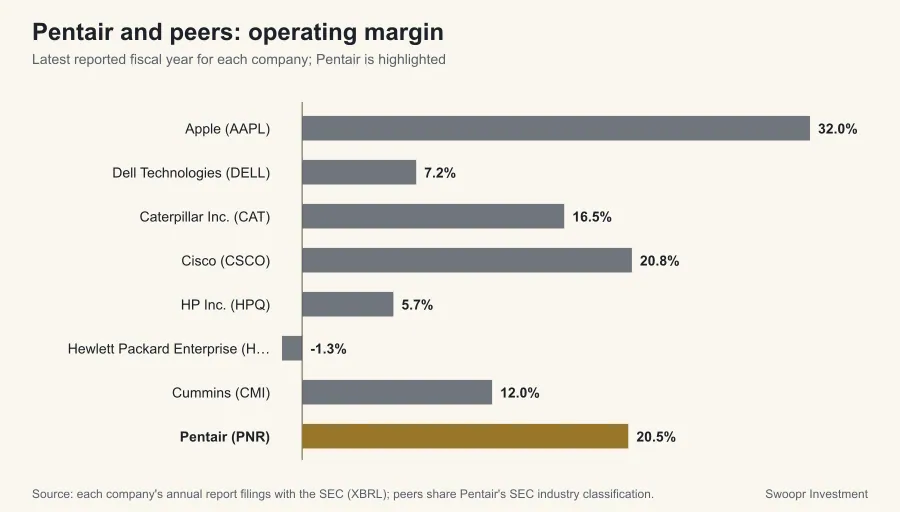
How Does Pentair Compare With Its Peers?
| Company | Revenue (latest FY) | Revenue growth | Operating margin | Net margin |
|---|---|---|---|---|
| Apple (AAPL) | $416 billion FY2025 | 6.4% | 32.0% | 26.9% |
| Dell Technologies (DELL) | $114 billion FY2026 | 18.8% | 7.2% | 5.2% |
| Caterpillar Inc. (CAT) | $67.6 billion FY2025 | 4.3% | 16.5% | 13.1% |
| IBM (IBM) | $67.5 billion FY2025 | 7.6% | n/a | 15.7% |
| Cisco (CSCO) | $56.7 billion FY2025 | 5.3% | 20.8% | 18.0% |
| HP Inc. (HPQ) | $55.3 billion FY2025 | 3.2% | 5.7% | 4.6% |
| Hewlett Packard Enterprise (HPE) | $34.3 billion FY2025 | 13.8% | -1.3% | 0.2% |
| Cummins (CMI) | $33.7 billion FY2025 | -1.3% | 12.0% | 8.8% |
| ASML Holding (ASML) | €32.7 billion FY2025 | 15.6% | 34.6% | 29.4% |
| Baker Hughes (BKR) | $27.7 billion FY2025 | -0.3% | n/a | 9.3% |
| Eaton Corporation (ETN) | $27.4 billion FY2025 | 10.3% | n/a | 14.9% |
| Johnson Controls (JCI) | $23.6 billion FY2025 | 2.8% | n/a | 13.9% |
| Lam Research (LRCX) | $23.2 billion FY2026 | 26.0% | 35.3% | 31.3% |
| Supermicro (SMCI) | $22.0 billion FY2025 | 46.6% | 5.7% | 4.8% |
| Carrier Global (CARR) | $21.7 billion FY2025 | -3.3% | 10.0% | 6.8% |
| Illinois Tool Works (ITW) | $16.0 billion FY2025 | 0.9% | 26.3% | 19.1% |
| AGCO Corporation (AGCO) | $10.1 billion FY2025 | -13.5% | 5.9% | 7.2% |
| Western Digital (WDC) | $9.5 billion FY2025 | 50.7% | 24.5% | 17.3% |
| Palo Alto Networks (PANW) | $9.2 billion FY2025 | 14.9% | 13.5% | 12.3% |
| Seagate Technology (STX) | $9.1 billion FY2025 | n/a | 20.8% | 16.1% |
| Xylem Inc. (XYL) | $9.0 billion FY2025 | 5.5% | 13.5% | 10.6% |
| Arista Networks (ANET) | $9.0 billion FY2025 | 28.6% | 42.8% | 0.0% |
| NOV Inc. (NOV) | $8.7 billion FY2025 | -1.4% | 5.6% | 1.7% |
| Dover Corporation (DOV) | $8.1 billion FY2025 | 4.5% | 17.0% | 13.5% |
| Ingersoll Rand (IR) | $7.7 billion FY2025 | 5.7% | 15.0% | 7.6% |
| Sandisk (SNDK) | $7.4 billion FY2025 | 10.4% | -18.7% | -22.3% |
| Xerox Holdings Corporation (XRX) | $7.0 billion FY2025 | 12.9% | n/a | -14.7% |
| Fortinet (FTNT) | $6.8 billion FY2025 | 14.2% | 30.7% | 27.3% |
| NetApp (NTAP) | $6.2 billion FY2026 | 5.6% | 26.8% | 20.5% |
| Regal Rexnord Corporation (RRX) | $5.9 billion FY2025 | -1.6% | 11.5% | 4.7% |
| Terex Corporation (TEX) | $5.4 billion FY2025 | 5.7% | 8.8% | 4.1% |
| Zebra Technologies (ZBRA) | $5.4 billion FY2025 | 8.3% | 13.0% | 7.8% |
| Brunswick Corporation (BC) | $5.4 billion FY2025 | 2.4% | -0.8% | -2.6% |
| Lennox International (LII) | $5.2 billion FY2025 | -2.7% | 20.0% | 15.5% |
| Weatherford International plc (WFRD) | $4.9 billion FY2025 | -10.8% | 15.4% | 8.8% |
| Logitech International S.A. (LOGI) | $4.8 billion FY2026 | 6.3% | 16.0% | 14.7% |
| Timken Company (The) (TKR) | $4.6 billion FY2025 | 0.2% | 11.8% | 6.3% |
| Toro Company (The) (TTC) | $4.5 billion FY2025 | -1.6% | 9.1% | 7.0% |
| Lincoln Electric Holdings Inc. (LECO) | $4.2 billion FY2025 | 5.6% | 17.0% | 12.3% |
| Pentair (PNR) | $4.2 billion FY2025 | 2.3% | 20.5% | 15.7% |
| ITT Inc. (ITT) | $3.9 billion FY2025 | 8.5% | 17.4% | 12.4% |
| Hyster-Yale Inc. (HY) | $3.8 billion FY2025 | -12.5% | -0.6% | -1.6% |
| Donaldson Company Inc. (DCI) | $3.7 billion FY2025 | 2.9% | 13.4% | 9.9% |
| Everpure Inc. (P) | $3.7 billion FY2026 | 15.6% | 3.1% | 5.1% |
| Curtiss-Wright Corporation (CW) | $3.5 billion FY2025 | 12.1% | 18.1% | 13.8% |
| IDEX Corporation (IEX) | $3.5 billion FY2025 | 5.8% | 20.2% | 14.0% |
| Middleby Corporation (The) (MIDD) | $3.2 billion FY2025 | 1.6% | 18.0% | 11.5% |
| BWX Technologies Inc. (BWXT) | $3.2 billion FY2025 | 18.3% | 12.6% | 10.3% |
| F5, Inc. (FFIV) | $3.1 billion FY2025 | 9.7% | 24.8% | 22.4% |
| ESAB Corporation (ESAB) | $2.8 billion FY2025 | 3.7% | 14.5% | 8.0% |
| Nordson Corporation (NDSN) | $2.8 billion FY2025 | 3.8% | 25.5% | 17.4% |
| SPX Technologies Inc. (SPXC) | $2.3 billion FY2025 | 14.2% | 15.5% | 10.8% |
| Symbotic Inc. (SYM) | $2.2 billion FY2025 | 25.7% | -5.1% | -0.8% |
| Manitowoc Company Inc. (The) (MTW) | $2.2 billion FY2025 | 2.9% | 2.4% | 0.3% |
| Graco Inc. (GGG) | $2.2 billion FY2025 | 5.8% | 27.9% | 23.3% |
| RBC Bearings Incorporated (RBC) | $1.9 billion FY2026 | 14.3% | 22.5% | 15.4% |
| Immersion Corporation (IMMR) | $1.7 billion FY2026 | 11.2% | 1.5% | 0.3% |
| Alliance Laundry Holdings Inc. (ALH) | $1.7 billion FY2025 | 13.3% | 18.6% | 5.8% |
| AAON Inc. (AAON) | $1.4 billion FY2025 | 20.1% | 10.1% | 7.5% |
| Columbus McKinnon Corporation (CMCO) | $1.2 billion FY2026 | 23.9% | -10.0% | -19.2% |
| Forum Energy Technologies Inc. (FET) | $791 million FY2025 | -3.1% | 3.8% | -1.2% |
| CECO Environmental Corp. (CECO) | $774 million FY2025 | 38.8% | 13.7% | 6.5% |
| Flowco Holdings Inc. (FLOC) | $760 million FY2025 | 41.9% | 19.6% | 5.4% |
| Power Solutions International Inc. (PSIX) | $722 million FY2025 | 51.8% | 15.2% | 15.8% |
| Cricut Inc. (CRCT) | $709 million FY2025 | -0.5% | 13.5% | 10.8% |
| NETGEAR Inc. (NTGR) | $700 million FY2025 | 3.8% | -4.9% | -2.6% |
| Gorman-Rupp Company (The) (GRC) | $682 million FY2025 | 3.4% | 14.0% | 7.8% |
| Oil States International Inc. (OIS) | $669 million FY2025 | -3.4% | -14.6% | -16.3% |
| Douglas Dynamics Inc. (PLOW) | $656 million FY2025 | 15.4% | 11.2% | 7.1% |
| Stratasys Ltd. (SSYS) | $551 million FY2025 | -3.7% | -13.2% | -18.9% |
| PAR Technology Corporation (PAR) | $456 million FY2025 | 30.2% | -15.1% | -18.5% |
| Ampco-Pittsburgh Corporation (AP) | $434 million FY2025 | 3.8% | -12.5% | -15.2% |
| NN Inc. (NNBR) | $422 million FY2025 | -9.1% | -4.5% | 8.1% |
| Twin Disc Incorporated (TWIN) | $341 million FY2025 | 15.5% | 3.3% | -0.6% |
| Quantum Corporation (QMCO) | $280 million FY2026 | 2.0% | -8.8% | -36.1% |
| Graham Corporation (GHM) | $245 million FY2026 | 16.9% | 6.1% | 5.1% |
| Perma-Pipe International Holdings Inc. (PPIH) | $211 million FY2026 | 33.2% | 14.0% | 8.1% |
| Mitek Systems Inc. (MITK) | $180 million FY2025 | 4.4% | 9.3% | 4.9% |
| Ouster Inc. (OUST) | $169 million FY2025 | 52.5% | -43.7% | -35.6% |
| Drilling Tools International Corporation (DTI) | $160 million FY2025 | 3.4% | n/a | -2.4% |
| Evolv Technologies Holdings Inc. (EVLV) | $146 million FY2025 | 40.5% | -33.2% | -22.7% |
| Energy Recovery Inc. (ERII) | $135 million FY2025 | -6.9% | 17.7% | 17.0% |
| Lantronix Inc. (LTRX) | $123 million FY2025 | -23.3% | -8.9% | -9.3% |
| Gencor Industries Inc. (GENC) | $115 million FY2025 | 2.0% | 12.1% | 13.6% |
| Capstone Energy Plus Inc. (CEPL) | $106 million FY2026 | 23.9% | 3.2% | 2.6% |
| Hyperscale Data Inc. (GPUS) | $102 million FY2025 | -4.3% | -61.0% | -65.0% |
| Amtech Systems Inc. (ASYS) | $79 million FY2025 | -21.6% | -35.9% | -38.2% |
| ChronoScale Holdings Corporation (CHRN) | $72 million FY2026 | -15.1% | -18.6% | -16.3% |
| Foxx Development Holdings Inc. (FOXX) | $66 million FY2025 | 1941.8% | -14.7% | -13.7% |
| TransAct Technologies Incorporated (TACT) | $51 million FY2025 | 18.7% | -2.7% | -2.4% |
| Velo3D Inc. (VELO) | $46 million FY2025 | 12.1% | -119.5% | -155.2% |
| Taylor Devices Inc. (TAYD) | $42 million FY2026 | -10.0% | 17.6% | 20.6% |
| Trio-Tech International (TRT) | $36 million FY2025 | -13.8% | 0.7% | -0.1% |
| One Stop Systems Inc. (OSS) | $32 million FY2025 | 31.2% | -10.5% | 15.8% |
| Chicago Rivet & Machine Co. (CVR) | $28 million FY2025 | 3.3% | -4.3% | -3.9% |
| Tecogen Inc. (TGEN) | $27 million FY2025 | 19.7% | -30.5% | -30.5% |
| Fuel Tech Inc. (FTEK) | $27 million FY2025 | 6.1% | -13.8% | -8.7% |
| CVD Equipment Corporation (CVV) | $26 million FY2025 | -4.1% | -7.4% | -6.1% |
| Art's-Way Manufacturing Co. Inc. (ARTW) | $23 million FY2025 | -6.2% | 1.3% | 4.5% |
| Identiv Inc. (INVE) | $21 million FY2025 | -19.3% | -103.1% | -83.8% |
| Sono-Tek Corporation (SOTK) | $21 million FY2026 | 2.0% | 8.7% | 8.6% |
| Socket Mobile Inc. (SCKT) | $15 million FY2025 | -19.6% | -21.3% | -95.4% |
| Interlink Electronics Inc. (LINK) | $12 million FY2025 | 1.8% | -15.4% | -13.6% |
| Intrusion Inc. (INTZ) | $7 million FY2025 | 21.6% | -130.6% | -0.1% |
| Nauticus Robotics Inc. (KITT) | $5 million FY2025 | 191.8% | -449.8% | -774.0% |
| Richtech Robotics Inc. (RR) | $5 million FY2025 | 19.0% | -340.9% | -972.7% |
| Virtuix Holdings Inc. (VTIX) | $4 million FY2026 | 18.4% | -242.7% | -395.0% |
| Serve Robotics Inc. (SERV) | $3 million FY2025 | 46.2% | -4253.8% | -3823.5% |
| VenHub Global Inc. (VHUB) | $864,450 FY2025 | n/a | -4561.4% | -7218.4% |
| Ainos Inc. (AIMD) | $124,157 FY2025 | 499.0% | -11268.3% | -11897.0% |
| Flowserve Corporation (FLS) | $0 FY2025 | n/a | n/a | n/a |
Revenue growth compares each company's latest fiscal year with the one before. Fiscal years do not always end on the same date, so treat close comparisons with care.
Where These Numbers Come From
Every figure on this page is a value Pentair reported in its own SEC filings, read from the SEC's XBRL data (accession 0000077360-26-000007 for fiscal year 2025). Ratios are computed from those reported values. Figures were retrieved on October 7, 2026; a later amendment or a new annual report can change them, and the filing itself always takes precedence over this summary.
Each fiscal year is labeled by the calendar year in which it ended, so a company that names the same period differently in its own filings (many retailers whose year ends in January) may use another label. A year is left out of the table when the SEC data set holds no value for it. A figure shown as "Not reported" means the company did not file a value under the standard tag Swoopr reads, not that the amount was zero. This page is educational and describes reported history only; it is not a forecast or a recommendation.
Frequently Asked Questions
Who are Pentair's competitors?
Companies sharing Pentair's SEC classification (SIC major group 35) include Apple (AAPL), Dell Technologies (DELL), Caterpillar Inc. (CAT), IBM (IBM), Cisco (CSCO). Its 10-K names the competitors it considers most relevant.
How does Pentair compare with its peers on margins?
Pentair's fiscal 2025 operating margin was 20.5%, against a peer median of 8.7%.
How are these peers chosen?
By the SEC Standard Industrial Classification code each company files under, within Swoopr's S&P 500 Equal Weight company set, falling back to the two-digit major group when fewer than two companies share the exact code. Classification codes are broad, so read the peer list as a screen, not a verdict.