
Direct Answer
SEC EDGAR classifies Oracle Corporation under SIC code 7372 (Services-Prepackaged Software). Among Swoopr's S&P 500 Equal Weight companies, 139 others share that classification; by latest reported revenue, Oracle Corporation ranks 2 of 140. A filing classification is a starting point: a company's real competitors depend on its segments, which its 10-K describes.
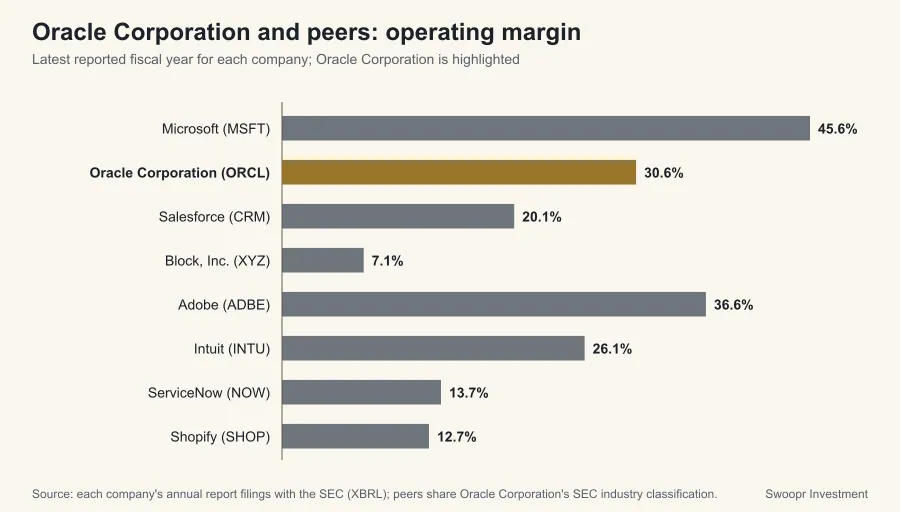
How Does Oracle Corporation Compare With Its Peers?
| Company | Revenue (latest FY) | Revenue growth | Operating margin | Net margin |
|---|---|---|---|---|
| Microsoft (MSFT) | $282 billion FY2025 | 14.9% | 45.6% | 36.1% |
| Oracle Corporation (ORCL) | $67.4 billion FY2026 | 17.3% | 30.6% | 25.2% |
| Salesforce (CRM) | $41.5 billion FY2026 | 9.6% | 20.1% | 18.0% |
| Block, Inc. (XYZ) | $24.2 billion FY2025 | 0.3% | 7.1% | 5.4% |
| Adobe (ADBE) | $23.8 billion FY2025 | 10.5% | 36.6% | 30.0% |
| Intuit (INTU) | $18.8 billion FY2025 | 15.6% | 26.1% | 20.5% |
| ServiceNow (NOW) | $13.3 billion FY2025 | 20.9% | 13.7% | 13.2% |
| Shopify (SHOP) | $11.6 billion FY2025 | 30.1% | 12.7% | 10.7% |
| Autodesk (ADSK) | $7.2 billion FY2026 | 17.5% | 21.9% | 15.6% |
| Synopsys (SNPS) | $7.1 billion FY2025 | 15.1% | 13.0% | 18.9% |
| Take-Two Interactive (TTWO) | $6.7 billion FY2026 | 18.2% | -1.6% | -4.5% |
| SS&C Technologies Holdings Inc. (SSNC) | $6.3 billion FY2025 | 6.6% | 22.9% | 12.7% |
| Cadence Design Systems (CDNS) | $5.3 billion FY2025 | 14.1% | 28.2% | 20.9% |
| CoreWeave (CRWV) | $5.1 billion FY2025 | 167.9% | -0.9% | -22.8% |
| Twilio Inc. (TWLO) | $5.1 billion FY2025 | 13.7% | 3.1% | 0.7% |
| Gen Digital (GEN) | $5.0 billion FY2026 | 27.1% | 42.4% | 19.5% |
| Roblox Corporation (RBLX) | $4.9 billion FY2025 | 35.8% | -25.2% | -21.9% |
| CrowdStrike (CRWD) | $4.8 billion FY2026 | 21.7% | -6.1% | -3.3% |
| Snowflake Inc. (SNOW) | $4.7 billion FY2026 | 29.2% | -30.6% | -28.4% |
| Palantir Technologies (PLTR) | $4.5 billion FY2025 | 56.2% | 31.6% | 36.3% |
| Datadog (DDOG) | $3.4 billion FY2025 | 27.7% | -1.3% | 3.1% |
| DocuSign Inc. (DOCU) | $3.2 billion FY2026 | 8.2% | 9.3% | 9.6% |
| Veeva Systems (VEEV) | $3.2 billion FY2026 | 16.3% | 28.7% | 28.4% |
| HubSpot Inc. (HUBS) | $3.1 billion FY2025 | 19.2% | 0.2% | 1.5% |
| Okta Inc. (OKTA) | $2.9 billion FY2026 | 11.8% | 5.1% | 8.1% |
| PTC Inc. (PTC) | $2.7 billion FY2025 | 19.2% | 35.9% | 26.8% |
| Nutanix Inc. (NTNX) | $2.5 billion FY2025 | 18.1% | 6.8% | 7.4% |
| Dropbox Inc. (DBX) | $2.5 billion FY2025 | -1.1% | 27.3% | 20.2% |
| MongoDB Inc. (MDB) | $2.5 billion FY2026 | 22.8% | -5.6% | -2.9% |
| Tyler Technologies (TYL) | $2.3 billion FY2025 | 9.1% | 15.3% | 13.5% |
| Cloudflare Inc. (NET) | $2.2 billion FY2025 | 29.8% | -9.6% | -4.7% |
| Dynatrace Inc. (DT) | $2.0 billion FY2026 | 18.8% | 12.2% | 8.1% |
| Unity Software Inc. (U) | $1.8 billion FY2025 | 2.0% | -25.9% | -21.8% |
| Elastic N.V. (ESTC) | $1.7 billion FY2026 | 17.3% | -1.9% | 21.1% |
| UiPath Inc. (PATH) | $1.6 billion FY2026 | 12.7% | 3.5% | 17.5% |
| Paylocity Holding Corporation (PCTY) | $1.6 billion FY2025 | 13.7% | 19.1% | 14.2% |
| Bentley Systems Incorporated (BSY) | $1.5 billion FY2025 | 11.0% | 24.1% | 18.5% |
| BILL Holdings Inc. (BILL) | $1.5 billion FY2025 | 13.4% | -5.5% | 1.6% |
| Procore Technologies Inc. (PCOR) | $1.3 billion FY2025 | 14.8% | -9.4% | -7.6% |
| Rubrik Inc. (RBRK) | $1.3 billion FY2026 | 48.5% | -26.2% | -0.0% |
| Zeta Global Holdings Corp. (ZETA) | $1.3 billion FY2025 | 29.7% | 0.4% | -2.4% |
| Klaviyo Inc. (KVYO) | $1.2 billion FY2025 | 31.6% | -5.5% | -2.6% |
| Guidewire Software Inc. (GWRE) | $1.2 billion FY2025 | 22.6% | 3.4% | 5.8% |
| Commvault Systems Inc. (CVLT) | $1.2 billion FY2026 | 18.9% | 6.3% | 6.0% |
| Manhattan Associates Inc. (MANH) | $1.1 billion FY2025 | 3.7% | 25.9% | 20.3% |
| SailPoint Inc. (SAIL) | $1.1 billion FY2026 | 24.4% | -28.7% | -25.2% |
| CCC Intelligent Solutions Holdings Inc. (CCC) | $1.1 billion FY2025 | 11.9% | 8.9% | 0.2% |
| Figma Inc. (FIG) | $1.1 billion FY2025 | 41.0% | -122.2% | -118.4% |
| Duolingo Inc. (DUOL) | $1.0 billion FY2025 | 38.7% | 13.1% | 39.9% |
| SentinelOne Inc. (S) | $1.0 billion FY2026 | 21.9% | -32.1% | -45.0% |
| ServiceTitan Inc. (TTAN) | $961 million FY2026 | 24.5% | -17.6% | -16.6% |
| GitLab Inc. (GTLB) | $955 million FY2026 | 25.8% | -7.4% | -6.1% |
| AppFolio Inc. (APPF) | $951 million FY2025 | 19.7% | 16.1% | 14.8% |
| Workiva Inc. (WK) | $885 million FY2025 | 19.7% | -4.8% | -3.0% |
| Rapid7 Inc. (RPD) | $860 million FY2025 | 1.9% | 1.3% | 2.7% |
| Freshworks Inc. (FRSH) | $839 million FY2025 | 16.4% | 1.6% | 21.9% |
| Asana Inc. (ASAN) | $791 million FY2026 | 9.2% | -25.0% | -23.9% |
| Coursera Inc. (COUR) | $758 million FY2025 | 9.0% | -10.2% | -6.7% |
| Bandwidth Inc. (BAND) | $754 million FY2025 | 0.7% | -1.9% | -1.7% |
| Vertex Inc. (VERX) | $748 million FY2025 | 12.2% | 0.3% | 1.0% |
| Braze Inc. (BRZE) | $738 million FY2026 | 24.4% | -19.6% | -17.8% |
| Appian Corporation (APPN) | $727 million FY2025 | 17.8% | 0.1% | 0.2% |
| Netskope Inc. (NTSK) | $709 million FY2026 | 31.7% | -92.0% | -95.8% |
| Navan Inc. (NAVN) | $702 million FY2026 | 30.8% | -28.0% | -56.7% |
| Qualys Inc. (QLYS) | $669 million FY2025 | 10.1% | 33.2% | 29.6% |
| Marqeta Inc. (MQ) | $625 million FY2025 | 23.3% | -7.4% | -2.2% |
| Fastly Inc. (FSLY) | $624 million FY2025 | 14.8% | -19.1% | -19.5% |
| Varonis Systems Inc. (VRNS) | $624 million FY2025 | 13.2% | -23.5% | -20.7% |
| nCino Inc. (NCNO) | $595 million FY2026 | 10.0% | 0.6% | 1.6% |
| EverCommerce Inc. (EVCM) | $589 million FY2025 | 4.8% | 10.1% | 3.0% |
| Skillsoft Corp. (SKIL) | $513 million FY2026 | -3.5% | -17.5% | -27.3% |
| Intapp Inc. (INTA) | $504 million FY2025 | 17.1% | -5.4% | -3.6% |
| PagerDuty Inc. (PD) | $493 million FY2026 | 5.4% | 1.2% | 35.1% |
| Sprout Social Inc (SPT) | $458 million FY2025 | 12.7% | -9.5% | -9.5% |
| Xperi Inc. (XPER) | $448 million FY2025 | -9.2% | -9.8% | -12.6% |
| Alkami Technology Inc. (ALKT) | $444 million FY2025 | 32.9% | -12.1% | -10.7% |
| Via Transportation Inc. (VIA) | $434 million FY2025 | 28.6% | -17.6% | -22.2% |
| AvePoint Inc. (AVPT) | $419 million FY2025 | 26.9% | 7.9% | 8.3% |
| Grid Dynamics Holdings Inc. (GDYN) | $412 million FY2025 | 17.5% | -0.5% | 2.3% |
| 3D Systems Corporation (DDD) | $387 million FY2025 | -12.1% | -24.8% | 7.7% |
| Consensus Cloud Solutions Inc. (CCSI) | $350 million FY2025 | -0.2% | 43.0% | 24.2% |
| Amplitude Inc. (AMPL) | $343 million FY2025 | 14.7% | n/a | -25.8% |
| Commerce.com Inc. Series 1 (CMRC) | $342 million FY2025 | 2.8% | -4.7% | -5.6% |
| MarketWise Inc. (MKTW) | $328 million FY2025 | -19.7% | 19.1% | 1.7% |
| Inspired Entertainment Inc. (INSE) | $304 million FY2025 | 2.4% | 10.0% | -5.6% |
| Cerence Inc. (CRNC) | $252 million FY2025 | -24.0% | -0.9% | -7.4% |
| C3.ai Inc. (AI) | $250 million FY2026 | -35.7% | -199.2% | -188.0% |
| Definitive Healthcare Corp. (DH) | $242 million FY2025 | -4.2% | -92.9% | -57.5% |
| Weave Communications Inc. (WEAV) | $239 million FY2025 | 17.0% | -12.8% | -11.7% |
| PLAYSTUDIOS Inc. (MYPS) | $235 million FY2025 | -18.8% | -10.2% | -12.2% |
| Upland Software Inc. (UPLD) | $217 million FY2025 | -21.1% | 2.0% | 18.6% |
| i3 Verticals Inc. (IIIV) | $213 million FY2025 | 11.5% | 1.8% | 8.4% |
| Meridian Holdings Inc. (MRDN) | $183 million FY2025 | 21.0% | -52.6% | -50.3% |
| Kaltura Inc. (KLTR) | $181 million FY2025 | 1.2% | -2.7% | -6.7% |
| SoundHound AI Inc (SOUN) | $169 million FY2025 | 99.4% | -13.8% | -0.0% |
| CS Disco Inc. (LAW) | $157 million FY2025 | 8.3% | -30.7% | -28.3% |
| Backblaze Inc. (BLZE) | $146 million FY2025 | 14.3% | -16.2% | -17.6% |
| Expensify Inc. (EXFY) | $142 million FY2025 | 2.1% | -12.7% | -15.1% |
| BigBear.ai Inc. (BBAI) | $128 million FY2025 | -19.3% | -167.5% | -230.3% |
| CareCloud Inc. (CCLD) | $120 million FY2025 | 8.7% | 9.4% | 0.0% |
| SoundThinking Inc. (SSTI) | $104 million FY2025 | 2.1% | -8.4% | -9.0% |
| Red Violet Inc. (RDVT) | $90 million FY2025 | 20.0% | 14.6% | 14.6% |
| eGain Corporation (EGAN) | $88 million FY2025 | -4.7% | 5.0% | 36.5% |
| Snail Inc. (SNAL) | $81 million FY2025 | -3.8% | -21.3% | -33.5% |
| NetSol Technologies Inc. (NTWK) | $73 million FY2025 | 13.4% | 4.8% | 4.0% |
| Silvaco Group Inc. (SVCO) | $63 million FY2025 | 5.7% | -72.8% | -65.3% |
| Marchex Inc. (MCHX) | $45 million FY2025 | -5.6% | -12.6% | -11.5% |
| Red Cat Holdings Inc. (RCAT) | $41 million FY2025 | n/a | -163.5% | -177.0% |
| AudioEye Inc. (AEYE) | $40 million FY2025 | 14.5% | -4.5% | -7.6% |
| FingerMotion Inc. (FNGR) | $36 million FY2024 | 5.1% | -10.7% | -10.6% |
| Duos Technologies Group Inc. (DUOT) | $27 million FY2025 | 271.2% | -36.1% | 0.0% |
| Where Food Comes From Inc. (WFCF) | $25 million FY2025 | -3.3% | 4.8% | 6.2% |
| Intellicheck Inc. (IDN) | $23 million FY2025 | 13.3% | 4.8% | 5.6% |
| FatPipe Inc. (FATN) | $19 million FY2026 | 17.9% | 18.7% | 25.9% |
| Smith Micro Software Inc. (SMSI) | $17 million FY2025 | -15.5% | -167.1% | -0.2% |
| Aware Inc. (AWRE) | $17 million FY2025 | -0.6% | -37.9% | 34.0% |
| Rank One Computing Corporation (ROC) | $17 million FY2025 | 23.9% | -11.8% | -15.8% |
| Great Elm Group Inc. (GEG) | $16 million FY2025 | -8.5% | -49.1% | 79.0% |
| Bridgeline Digital Inc. (BLIN) | $15 million FY2025 | 0.2% | -15.8% | -16.4% |
| Airship AI Holdings Inc. (AISP) | $15 million FY2025 | -33.5% | -47.1% | 191.4% |
| Banzai International Inc. (PARA) | $12 million FY2025 | 168.6% | -151.8% | -184.9% |
| Motorsport Games Inc. (MSGM) | $11 million FY2025 | 30.0% | 28.8% | 61.3% |
| Exascale Labs Holdings Inc. (XLAB) | $7 million FY2025 | n/a | -43.4% | -109.2% |
| BIO-key International Inc. (BKYI) | $6 million FY2025 | -14.3% | -115.0% | 120.6% |
| Exyn Technologies Inc. (EXYN) | $6 million FY2025 | 4.4% | -166.2% | -209.8% |
| Iveda Solutions Inc. (IVDA) | $5 million FY2025 | -12.3% | -61.1% | -60.6% |
| Palladyne AI Corp. (PDYN) | $5 million FY2025 | -32.6% | -617.7% | 191.4% |
| CXApp Inc. (CXAI) | $5 million FY2025 | -35.8% | -383.5% | -293977.7% |
| T Stamp Inc. (IDAI) | $3 million FY2025 | 1.9% | -244.0% | -265.2% |
| authID Inc. (AUID) | $2 million FY2025 | 130.2% | -889.6% | -878.8% |
| Gaxos.ai Inc. (GXAI) | $2 million FY2025 | 47901.7% | -254.3% | -201.8% |
| Aether Holdings Inc. (ATHR) | $1 million FY2025 | -4.1% | n/a | -227.5% |
| Firefly Neuroscience Inc. (AIFF) | $1 million FY2025 | 957.4% | -775.5% | -1741.0% |
| Pixelworks Inc. (PXLW) | $693,000 FY2025 | 0.4% | -1667.5% | -3246.6% |
| Quantum Computing Inc. (QUBT) | $682,000 FY2025 | 82.8% | -7489.3% | -2738.1% |
| Safe Pro Group Inc. (SPAI) | $606,681 FY2025 | -72.0% | -2397.6% | -2360.8% |
| Sports Entertainment Gaming Global Corporation (SEGG) | $559,590 FY2025 | -41.6% | -3193.0% | -3628.3% |
| Swarmer Inc (SWMR) | $309,920 FY2025 | -5.9% | -1650.8% | -2752.1% |
| Amesite Inc. (AMST) | $110,459 FY2025 | -33.8% | -3262.4% | -5990.5% |
| Game Your Game Inc. (GYGY) | $58,505 FY2025 | 293.2% | -1831.4% | -1339.7% |
Revenue growth compares each company's latest fiscal year with the one before. Fiscal years do not always end on the same date, so treat close comparisons with care.
How Does Oracle Corporation Rank Among All SEC Filers in Its Industry Code?
140 companies with annual reports in Swoopr's SEC dataset share SIC code 7372 (Services-Prepackaged Software), a wider group than the S&P 500 Equal Weight companies above. Ranks run from 1 (highest) and use each company's latest fiscal year, in U.S. dollars.
| Measure | Oracle Corporation | Median of filers | Rank |
|---|---|---|---|
| Revenue | $67.4 billion | $551 million | 2 of 140 |
| Revenue growth | 17.3% | 13.5% | 53 of 138 |
| Operating margin | 30.6% | -5.5% | 8 of 138 |
| Net margin | 25.2% | -2.3% | 17 of 140 |
A SIC code reflects the filer's main business as the SEC records it, so the group mixes companies of very different size; the median is a better guide than the average, and a rank near the top by revenue says nothing about quality.
Where These Numbers Come From
Every figure on this page is a value Oracle Corporation reported in its own SEC filings, read from the SEC's XBRL data (accession 0001193125-26-277521 for fiscal year 2026). Ratios are computed from those reported values. Figures were retrieved on October 12, 2026; a later amendment or a new annual report can change them, and the filing itself always takes precedence over this summary.
Each fiscal year is labeled by the calendar year in which it ended, so a company that names the same period differently in its own filings (many retailers whose year ends in January) may use another label. A year is left out of the table when the SEC data set holds no value for it. A figure shown as "Not reported" means the company did not file a value under the standard tag Swoopr reads, not that the amount was zero. This page is educational and describes reported history only; it is not a forecast or a recommendation.
Frequently Asked Questions
Who are Oracle Corporation's competitors?
Companies sharing Oracle Corporation's SEC classification (SIC code 7372 (Services-Prepackaged Software)) include Microsoft (MSFT), Salesforce (CRM), Block, Inc. (XYZ), Adobe (ADBE), Intuit (INTU). Its 10-K names the competitors it considers most relevant.
How does Oracle Corporation compare with its peers on margins?
Oracle Corporation's fiscal 2026 operating margin was 30.6%, against a peer median of -5.5%.
How are these peers chosen?
By the SEC Standard Industrial Classification code each company files under, within Swoopr's S&P 500 Equal Weight company set, falling back to the two-digit major group when fewer than two companies share the exact code. Classification codes are broad, so read the peer list as a screen, not a verdict.
How does Oracle Corporation rank among all companies in its SEC industry?
Among 140 SEC filers under SIC code 7372, Oracle Corporation ranks 2 by latest revenue, and 8 of 138 by operating margin (30.6% against a median of -5.5%).