
Direct Answer
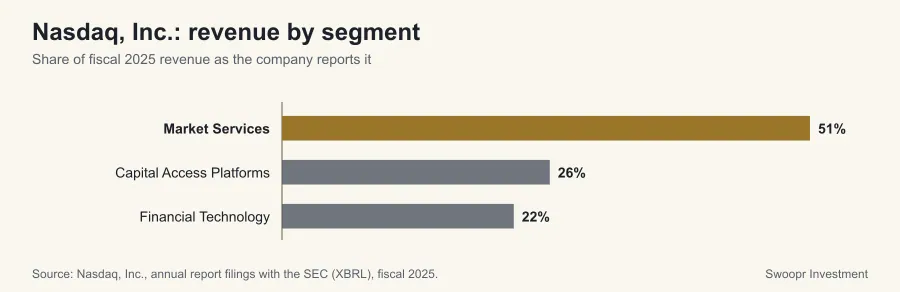
Nasdaq, Inc. reports revenue across 3 business segments in its fiscal 2025 Form 10-K. Market Services is the largest, with $4.2 billion of revenue (51% of the total), followed by Capital Access Platforms at $2.1 billion (26%). 72% of revenue came from the United States.
How Does Nasdaq, Inc. Make Money?
No single line supplies a majority of revenue: the largest, Market Services, is 51%, which spreads Nasdaq, Inc.'s exposure across several demand drivers. Between fiscal 2024 and 2025, Financial Technology grew fastest (+14.1%) and Capital Access Platforms slowest (+9.9%), so the revenue mix tilts toward Financial Technology while that gap lasts.
| Segment | FY2025 revenue | FY2024 revenue | Share of revenue | Change |
|---|---|---|---|---|
| Market Services | $4.2 billion | $3.8 billion | 51.0% | 11.7% |
| Capital Access Platforms | $2.1 billion | $1.9 billion | 25.9% | 9.9% |
| Financial Technology | $1.9 billion | $1.6 billion | 22.4% | 14.1% |
Which Nasdaq, Inc. Segments Earn the Most?
| Segment | FY2025 segment operating income | Segment margin |
|---|---|---|
| Market Services | $764 million | 18.1% |
| Capital Access Platforms | $1.3 billion | 59.6% |
| Financial Technology | $860 million | 46.5% |
Segment operating income is the profit measure Nasdaq, Inc. reports to its chief operating decision maker for each segment. It usually leaves out corporate costs that are not allocated to a segment, so the segments usually add up to more than consolidated operating income, and margins are comparable within Nasdaq, Inc. more safely than against another company.
Where Does Nasdaq, Inc.'s Revenue Come From?
Regions follow the definitions in the filing; most companies assign revenue by customer location.
| Region | FY2025 revenue | FY2024 revenue | Share of revenue | Change |
|---|---|---|---|---|
| United States | $5.9 billion | $5.8 billion | 72.0% | 2.2% |
| Outside the United States | $2.3 billion | $1.6 billion | 28.0% | 46.2% |
What the Segment Figures Do Not Show
The rows above add up to 99% of Nasdaq, Inc.'s reported revenue for fiscal 2025; the difference is intersegment eliminations, corporate revenue or items the company reports outside its segments. Segment definitions are management's choice and change when a company reorganizes, in which case it restates prior years in the next filing, so a multi-year comparison should use the figures from a single filing. Revenue shows where sales come from, not where profit or cash is earned: a small segment can carry most of the margin.
Where These Numbers Come From
Every figure on this page is a value Nasdaq, Inc. reported in the segment note and revenue disclosures of its Form 10-K filed February 12, 2026 (accession 0001628280-26-007703), read from the SEC's Financial Statement Data Sets. The prior-year column is the comparative figure from that same filing, so it reflects any restatement for a change in segments. Category names are the company's own XBRL labels, lightly reformatted for reading.
Rows that only total other rows (for example a "Products" line beside the individual products) are left out so nothing is counted twice. This page is educational and describes reported history for fiscal 2025; it is not a forecast or a recommendation.
Frequently Asked Questions
What are Nasdaq, Inc.'s business segments?
In its fiscal 2025 Form 10-K, Nasdaq, Inc. reports revenue for Market Services, Capital Access Platforms and Financial Technology.
Which part of Nasdaq, Inc. brings in the most revenue?
Market Services, with $4.2 billion of revenue in fiscal 2025, or 51% of the total.
How much of Nasdaq, Inc.'s revenue comes from outside the United States?
28% in fiscal 2025, by the geographic breakdown Nasdaq, Inc. reports in its Form 10-K. Companies assign revenue to regions differently (customer location, shipping address or selling entity), so check the filing's definition before comparing companies.