
Direct Answer
SEC EDGAR classifies Molson Coors Beverage Company under SIC major group 20. Among Swoopr's S&P 500 Equal Weight companies, 49 others share that classification; by latest reported revenue, Molson Coors Beverage Company ranks 13 of 50. A filing classification is a starting point: a company's real competitors depend on its segments, which its 10-K describes.
How Does Molson Coors Beverage Company Compare With Its Peers?
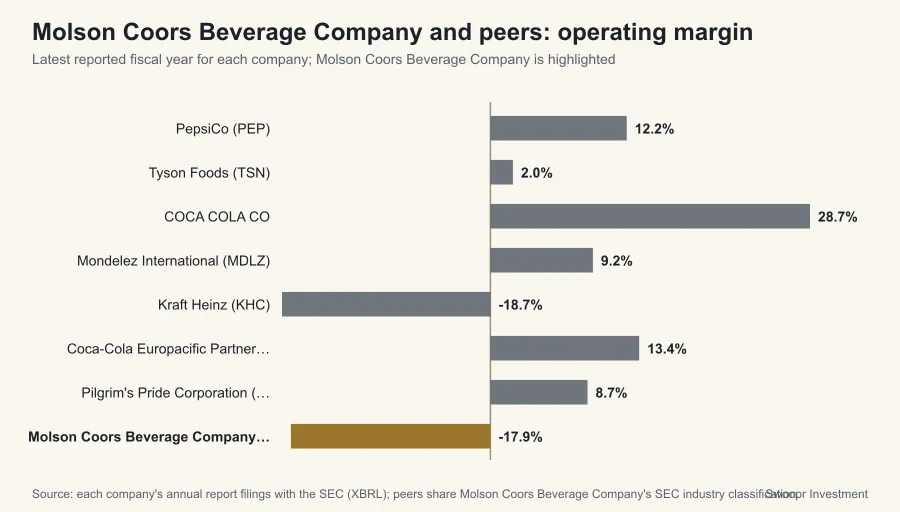
| Company | Revenue (latest FY) | Revenue growth | Operating margin | Net margin |
|---|---|---|---|---|
| PepsiCo (PEP) | $93.9 billion FY2025 | 2.3% | 12.2% | 8.8% |
| Archer Daniels Midland (ADM) | $80.3 billion FY2025 | -6.2% | n/a | 1.3% |
| Bunge Global (BG) | $70.3 billion FY2025 | 32.4% | n/a | 1.2% |
| Tyson Foods (TSN) | $54.4 billion FY2025 | 2.1% | 2.0% | 0.9% |
| COCA COLA CO | $47.9 billion FY2025 | 1.9% | 28.7% | 27.3% |
| Mondelez International (MDLZ) | $38.5 billion FY2025 | 5.8% | 9.2% | 6.4% |
| Kraft Heinz (KHC) | $24.9 billion FY2025 | -3.5% | -18.7% | -23.4% |
| Coca-Cola Europacific Partners (CCEP) | €20.9 billion FY2025 | 2.3% | 13.4% | 9.3% |
| Pilgrim's Pride Corporation (PPC) | $18.5 billion FY2025 | 3.5% | 8.7% | 5.9% |
| General Mills (GIS) | $18.4 billion FY2026 | -5.4% | 4.8% | -0.5% |
| Keurig Dr Pepper (KDP) | $16.6 billion FY2025 | 8.2% | 21.5% | 12.5% |
| Smithfield Foods Inc. (SFD) | $15.5 billion FY2025 | 9.8% | 8.3% | 6.4% |
| Molson Coors Beverage Company (TAP) | $13.0 billion FY2025 | -5.1% | -17.9% | -16.4% |
| Hormel Foods (HRL) | $12.1 billion FY2025 | 1.6% | 5.9% | 4.0% |
| HERSHEY CO | $11.7 billion FY2025 | 4.4% | 12.3% | 7.6% |
| Constellation Brands (STZ) | $9.1 billion FY2026 | -10.5% | 29.8% | 18.5% |
| J M SMUCKER Co | $9.1 billion FY2026 | 3.7% | 4.0% | -1.5% |
| Monster Beverage (MNST) | $8.3 billion FY2025 | 10.7% | 29.2% | 23.0% |
| Post Holdings Inc. (POST) | $8.2 billion FY2025 | 3.0% | 9.8% | 4.1% |
| Coca-Cola Consolidated Inc. (COKE) | $7.2 billion FY2025 | 4.8% | 13.2% | 7.9% |
| Ingredion Incorporated (INGR) | $7.2 billion FY2025 | -2.8% | 14.1% | 10.1% |
| McCormick & Company Incorporated (MKC) | $6.8 billion FY2025 | 1.7% | 15.7% | 11.5% |
| Primo Brands Corporation (PRMB) | $6.7 billion FY2025 | 29.3% | 6.5% | 0.9% |
| Darling Ingredients Inc. (DAR) | $6.1 billion FY2025 | 7.4% | 4.5% | 1.0% |
| Brown-Forman (BF.B) | $3.9 billion FY2026 | -1.2% | 25.5% | 18.2% |
| Celsius Holdings Inc. (CELH) | $2.5 billion FY2025 | 85.5% | 5.6% | 4.3% |
| BellRing Brands Inc. (BRBR) | $2.3 billion FY2025 | 16.1% | 15.4% | 9.3% |
| Boston Beer Company Inc. (The) (SAM) | $2.0 billion FY2025 | -2.4% | 7.4% | 5.6% |
| The Marzetti Company (MZTI) | $1.9 billion FY2025 | 2.0% | 11.5% | 8.8% |
| B&G Foods Inc. (BGS) | $1.8 billion FY2025 | -5.4% | 5.3% | -2.4% |
| Seneca Foods Corp. (SENEA) | $1.6 billion FY2025 | 8.2% | 4.9% | 2.6% |
| Hain Celestial Group Inc. (The) (HAIN) | $1.6 billion FY2025 | -10.2% | -29.6% | -34.0% |
| Utz Brands Inc (UTZ) | $1.4 billion FY2025 | 2.1% | 1.4% | 0.1% |
| Westrock Coffee Company (WEST) | $1.2 billion FY2025 | 39.8% | -3.8% | -7.6% |
| Vital Farms Inc. (VITL) | $759 million FY2025 | 25.3% | 11.6% | 8.7% |
| BRC Inc. (BRCC) | $398 million FY2025 | 1.7% | -6.2% | -3.0% |
| MEDIFAST INC (MED) | $386 million FY2025 | -36.0% | -3.7% | -4.9% |
| Beyond Meat Inc. (BYND) | $275 million FY2025 | -15.6% | -121.1% | 79.5% |
| Bridgford Foods Corporation (BRID) | $231 million FY2025 | 3.3% | -8.1% | -5.8% |
| Lifeway Foods Inc. (LWAY) | $212 million FY2025 | 13.7% | 7.6% | 6.5% |
| Mama's Creations Inc. (MAMA) | $172 million FY2026 | 39.2% | 4.1% | 3.1% |
| Zevia PBC (ZVIA) | $161 million FY2025 | 4.0% | -7.3% | -6.2% |
| Coffee Holding Co. Inc. (JVA) | $96 million FY2025 | 22.6% | 2.2% | 1.5% |
| Willamette Valley Vineyards Inc. (WVVI) | $37 million FY2025 | -6.5% | -3.9% | -2.5% |
| Rocky Mountain Chocolate Factory Inc. (RMCF) | $27 million FY2026 | -7.0% | -13.0% | -0.0% |
| Barfresh Food Group Inc. (BRFH) | $14 million FY2025 | 32.6% | -24.2% | -19.0% |
| BranchOut Food Inc. (BOF) | $14 million FY2025 | 113.3% | -39.1% | -44.6% |
| IP Strategy Holdings Inc. (IPST) | $10 million FY2025 | 20.4% | -1323.6% | -1360.9% |
| LQR House Inc. (YHC) | $2 million FY2025 | -37.4% | -730.3% | -1631.0% |
| Sow Good Inc. (SOWG) | $0 FY2025 | n/a | n/a | n/a |
Revenue growth compares each company's latest fiscal year with the one before. Fiscal years do not always end on the same date, so treat close comparisons with care.
Where These Numbers Come From
Every figure on this page is a value Molson Coors Beverage Company reported in its own SEC filings, read from the SEC's XBRL data (accession 0000024545-26-000006 for fiscal year 2025). Ratios are computed from those reported values. Figures were retrieved on October 12, 2026; a later amendment or a new annual report can change them, and the filing itself always takes precedence over this summary.
Each fiscal year is labeled by the calendar year in which it ended, so a company that names the same period differently in its own filings (many retailers whose year ends in January) may use another label. A year is left out of the table when the SEC data set holds no value for it. A figure shown as "Not reported" means the company did not file a value under the standard tag Swoopr reads, not that the amount was zero. This page is educational and describes reported history only; it is not a forecast or a recommendation.
Frequently Asked Questions
Who are Molson Coors Beverage Company's competitors?
Companies sharing Molson Coors Beverage Company's SEC classification (SIC major group 20) include PepsiCo (PEP), Archer Daniels Midland (ADM), Bunge Global (BG), Tyson Foods (TSN), COCA COLA CO. Its 10-K names the competitors it considers most relevant.
How does Molson Coors Beverage Company compare with its peers on margins?
Molson Coors Beverage Company's fiscal 2025 operating margin was -17.9%, against a peer median of 5.5%.
How are these peers chosen?
By the SEC Standard Industrial Classification code each company files under, within Swoopr's S&P 500 Equal Weight company set, falling back to the two-digit major group when fewer than two companies share the exact code. Classification codes are broad, so read the peer list as a screen, not a verdict.