
Direct Answer
SEC EDGAR classifies Iron Mountain under SIC code 6798 (Real Estate Investment Trusts). Among Swoopr's S&P 500 Equal Weight companies, 111 others share that classification; by latest reported revenue, Iron Mountain ranks 6 of 112. A filing classification is a starting point: a company's real competitors depend on its segments, which its 10-K describes.
How Does Iron Mountain Compare With Its Peers?
| Company | Revenue (latest FY) | Revenue growth | Operating margin | Net margin |
|---|---|---|---|---|
| Welltower (WELL) | $10.8 billion FY2025 | 35.6% | n/a | 8.6% |
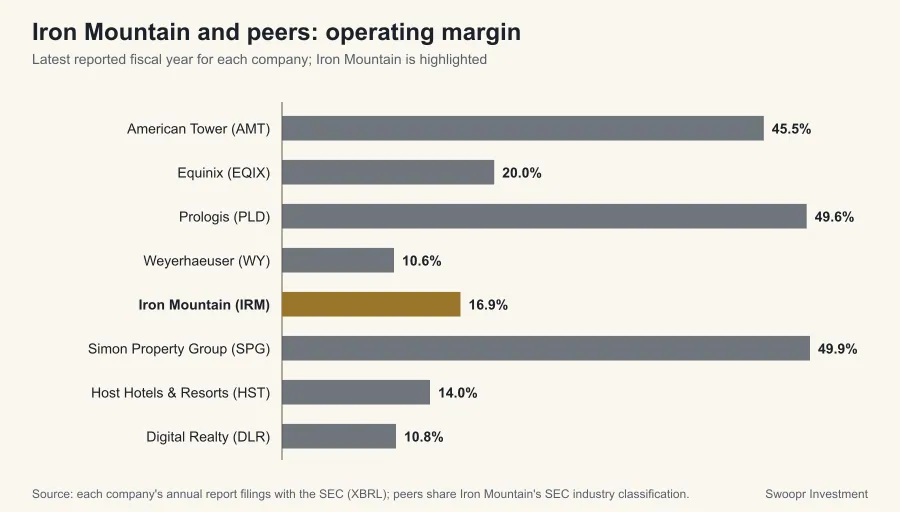
| American Tower (AMT) | $10.6 billion FY2025 | 5.1% | 45.5% | 24.7% |
| Equinix (EQIX) | $9.2 billion FY2025 | 5.4% | 20.0% | 14.6% |
| Prologis (PLD) | $8.8 billion FY2025 | 7.2% | 49.6% | 37.9% |
| Weyerhaeuser (WY) | $6.9 billion FY2025 | -3.1% | 10.6% | 4.7% |
| Iron Mountain (IRM) | $6.9 billion FY2025 | 12.2% | 16.9% | 2.2% |
| Simon Property Group (SPG) | $6.4 billion FY2025 | 6.7% | 49.9% | 84.3% |
| Host Hotels & Resorts (HST) | $6.1 billion FY2025 | 7.6% | 14.0% | 12.5% |
| Digital Realty (DLR) | $6.1 billion FY2025 | 10.0% | 10.8% | 21.5% |
| Ventas (VTR) | $5.8 billion FY2025 | 18.5% | n/a | 4.5% |
| Realty Income (O) | $5.7 billion FY2025 | 9.1% | n/a | 18.4% |
| Lineage Inc. (LINE) | $5.4 billion FY2025 | 0.3% | 3.4% | -2.1% |
| Public Storage (PSA) | $4.8 billion FY2025 | 2.7% | n/a | 37.0% |
| Crown Castle (CCI) | $4.3 billion FY2025 | -4.4% | 48.7% | 10.4% |
| Vici Properties (VICI) | $4.0 billion FY2025 | 4.1% | n/a | 69.3% |
| BXP, Inc. (BXP) | $3.5 billion FY2025 | 2.2% | n/a | 7.9% |
| Extra Space Storage (EXR) | $3.4 billion FY2025 | 3.7% | 41.8% | 28.8% |
| Vivmark Residential (VMRK) | $3.1 billion FY2025 | 3.8% | n/a | 36.2% |
| Alexandria Real Estate Equities (ARE) | $3.0 billion FY2025 | -2.9% | n/a | -47.2% |
| Healthpeak Properties (DOC) | $2.8 billion FY2025 | 4.5% | n/a | 2.5% |
| SBA Communications (SBAC) | $2.8 billion FY2025 | 5.1% | 47.7% | 37.4% |
| Americold Realty Trust Inc. (COLD) | $2.6 billion FY2025 | -2.4% | 0.3% | -4.4% |
| Sun Communities Inc. (SUI) | $2.3 billion FY2025 | 2.0% | n/a | 61.3% |
| Lamar Advertising Company (LAMR) | $2.3 billion FY2025 | 2.7% | 34.2% | 25.9% |
| American Healthcare REIT Inc. (AHR) | $2.3 billion FY2025 | 9.1% | 18.4% | 3.1% |
| Mid-America Apartment Communities (MAA) | $2.2 billion FY2025 | 0.8% | n/a | 20.2% |
| Kimco Realty (KIM) | $2.1 billion FY2025 | 5.1% | 36.0% | 25.9% |
| Essex Property Trust (ESS) | $1.9 billion FY2025 | 6.4% | 47.6% | 37.2% |
| STARWOOD PROPERTY TRUST INC. Starwood Property Trust Inc. (STWD) | $1.8 billion FY2025 | -5.3% | n/a | 22.3% |
| Service Properties Trust (SVC) | $1.8 billion FY2025 | -4.3% | n/a | -11.1% |
| Vornado Realty Trust (VNO) | $1.8 billion FY2025 | 1.3% | n/a | 51.8% |
| W. P. Carey Inc. (WPC) | $1.7 billion FY2025 | 8.4% | n/a | 27.2% |
| UDR, Inc. (UDR) | $1.7 billion FY2025 | 2.4% | 32.3% | 22.1% |
| Gaming and Leisure Properties Inc. (GLPI) | $1.6 billion FY2025 | 4.1% | 75.3% | 0.0% |
| Regency Centers (REG) | $1.6 billion FY2025 | 6.9% | 72.3% | 34.0% |
| Diversified Healthcare Trust (DHC) | $1.5 billion FY2025 | 2.8% | n/a | -18.6% |
| Equity Lifestyle Properties Inc. (ELS) | $1.5 billion FY2025 | 0.3% | 25.6% | 26.3% |
| Pebblebrook Hotel Trust (PEB) | $1.5 billion FY2025 | 1.5% | 3.0% | -4.5% |
| Howard Hughes Holdings Inc. (HHH) | $1.5 billion FY2025 | -15.8% | 22.5% | 8.4% |
| Brixmor Property Group Inc. (BRX) | $1.4 billion FY2025 | 6.7% | n/a | 28.2% |
| RLJ Lodging Trust (RLJ) | $1.3 billion FY2025 | -1.4% | n/a | 2.1% |
| Federal Realty Investment Trust (FRT) | $1.3 billion FY2025 | 6.4% | 47.1% | 32.1% |
| Omega Healthcare Investors Inc. (OHI) | $1.2 billion FY2025 | 13.2% | n/a | 0.1% |
| Healthcare Realty Trust Incorporated (HR) | $1.2 billion FY2025 | -6.9% | n/a | -21.1% |
| CubeSmart (CUBE) | $1.1 billion FY2025 | 5.3% | n/a | 29.5% |
| Kilroy Realty Corporation (KRC) | $1.1 billion FY2025 | -2.0% | n/a | 0.0% |
| Ashford Hospitality Trust Inc (AHT) | $1.1 billion FY2025 | -5.8% | 10.5% | -16.3% |
| Rexford Industrial Realty Inc. (REXR) | $1.0 billion FY2025 | 7.1% | n/a | 21.9% |
| Cousins Properties Incorporated (CUZ) | $994 million FY2025 | 16.0% | 67.8% | 4.1% |
| NNN REIT Inc. (NNN) | $926 million FY2025 | 6.6% | 63.6% | 42.1% |
| Stag Industrial Inc. (STAG) | $845 million FY2025 | 10.1% | n/a | 32.4% |
| Kite Realty Group Trust (KRG) | $844 million FY2025 | 0.8% | n/a | 35.4% |
| Sabra Health Care REIT Inc. (SBRA) | $775 million FY2025 | 10.2% | n/a | 20.1% |
| Empire State Realty Trust Inc. (ESRT) | $768 million FY2025 | 0.0% | 17.7% | 9.5% |
| COPT Defense Properties (CDP) | $764 million FY2025 | 1.4% | n/a | 20.9% |
| Summit Hotel Properties Inc. (INN) | $729 million FY2025 | -0.3% | 9.0% | -1.6% |
| First Industrial Realty Trust Inc. (FR) | $727 million FY2025 | 8.6% | n/a | 34.0% |
| EastGroup Properties Inc. (EGP) | $721 million FY2025 | 12.7% | n/a | 35.7% |
| Agree Realty Corporation (ADC) | $718 million FY2025 | 16.4% | 47.4% | 28.4% |
| EPR Properties (EPR) | $718 million FY2025 | 2.9% | 57.7% | 38.3% |
| Braemar Hotels & Resorts Inc. (BHR) | $704 million FY2025 | -3.3% | 10.3% | -3.2% |
| Independence Realty Trust Inc. (IRT) | $658 million FY2025 | 2.8% | n/a | 8.6% |
| CBL & Associates Properties Inc. (CBL) | $578 million FY2025 | 12.2% | n/a | 23.5% |
| Rayonier Inc. (RYN) | $484 million FY2025 | -51.0% | 17.2% | 97.9% |
| Brandywine Realty Trust (BDN) | $484 million FY2025 | -4.2% | 5.5% | -36.8% |
| CareTrust REIT Inc. (CTRE) | $476 million FY2025 | 60.8% | n/a | 67.3% |
| Acadia Realty Trust (AKR) | $411 million FY2025 | 14.2% | 12.0% | 4.1% |
| LXP Industrial Trust (LXP) | $350 million FY2025 | -2.3% | n/a | 32.3% |
| National Healthcare Properties Inc. (NHP) | $342 million FY2025 | -3.3% | 1.0% | -16.9% |
| BrightSpire Capital Inc. (BRSP) | $331 million FY2025 | -7.9% | n/a | -9.4% |
| Chatham Lodging Trust (REIT) (CLDT) | $295 million FY2025 | -7.0% | 13.9% | 5.1% |
| SmartStop Self Storage REIT Inc. (SMA) | $281 million FY2025 | 18.6% | 21.0% | -0.6% |
| Centerspace (CSR) | $274 million FY2025 | 4.9% | 23.6% | 6.2% |
| Apollo Commercial Real Estate Finance Inc (ARI) | $272 million FY2025 | -10.6% | n/a | 46.7% |
| UMH Properties Inc. (UMH) | $262 million FY2025 | 8.8% | n/a | 2.3% |
| Elme Communities (ELME) | $242 million FY2024 | 6.2% | 9.7% | -5.4% |
| Alexander's Inc. (ALX) | $213 million FY2025 | -5.8% | n/a | 13.2% |
| Strawberry Fields REIT Inc. (STRW) | $155 million FY2025 | 32.4% | 54.4% | 4.9% |
| Clipper Realty Inc. (CLPR) | $153 million FY2025 | 3.0% | 2.7% | -34.2% |
| CTO Realty Growth Inc. (CTO) | $150 million FY2025 | 20.1% | 22.7% | 1.7% |
| Chiron Real Estate Inc. (XRN) | $148 million FY2025 | 6.8% | n/a | -4.6% |
| Orion Properties Inc. (ONL) | $148 million FY2025 | -10.4% | n/a | -94.4% |
| Apartment Investment and Management Company (AIV) | $138 million FY2025 | 0.6% | n/a | 395.1% |
| SITE Centers Corp. (SITC) | $124 million FY2025 | -55.4% | n/a | 143.8% |
| Community Healthcare Trust Incorporated (CHCT) | $121 million FY2025 | 4.7% | n/a | 4.2% |
| Net Lease Office Properties (NLOP) | $119 million FY2025 | -16.4% | n/a | -122.2% |
| Creative Media & Community Trust Corporation (CMCT) | $117 million FY2025 | -6.3% | n/a | -33.4% |
| Franklin Street Properties Corp. (FSP) | $107 million FY2025 | -10.8% | n/a | -42.0% |
| BRT Apartments Corp. (MD) (BRT) | $97 million FY2025 | 1.5% | -12.9% | -12.3% |
| Postal Realty Trust Inc. (PSTL) | $96 million FY2025 | 25.5% | 35.8% | 14.8% |
| Gladstone Land Corporation (LAND) | $88 million FY2025 | 3.7% | n/a | 15.3% |
| NexPoint Diversified Real Estate Trust (NXDT) | $86 million FY2025 | 3.3% | -1.6% | -147.8% |
| ACRES Commercial Realty Corp. (ACR) | $80 million FY2025 | -4.2% | n/a | 35.0% |
| FrontView REIT Inc. (FVR) | $67 million FY2025 | n/a | -8.3% | -5.7% |
| Alpine Income Property Trust Inc. (PINE) | $61 million FY2025 | 15.9% | 21.7% | -4.4% |
| Sachem Capital Corp. (SACH) | $58 million FY2024 | -11.2% | -30.9% | -68.8% |
| Ares Commercial Real Estate Corporation (ACRE) | $55 million FY2025 | -21.3% | n/a | -1.6% |
| Farmland Partners Inc. (FPI) | $52 million FY2025 | -10.4% | n/a | 60.5% |
| Transcontinental Realty Investors Inc. (TCI) | $49 million FY2025 | 4.2% | -12.9% | 28.1% |
| Chicago Atlantic Real Estate Finance Inc. (REFI) | $49 million FY2022 | n/a | n/a | 66.1% |
| Seven Hills Realty Trust (SEVN) | $29 million FY2025 | -16.7% | n/a | 52.5% |
| MacKenzie Realty Capital Inc. (MKZR) | $22 million FY2025 | 40.2% | -106.4% | -108.7% |
| Sunrise Realty Trust Inc. (SUNS) | $22 million FY2025 | 103.0% | n/a | 56.3% |
| Presidio Property Trust Inc. (SQFT) | $17 million FY2025 | -11.2% | 63.4% | -49.2% |
| Camden Property Trust (CPT) | $13 million FY2025 | 81.7% | n/a | 2964.9% |
| Global Self Storage Inc. (SELF) | $13 million FY2025 | 1.4% | 23.3% | 16.0% |
| Medalist Diversified Inc. (MDRR) | $10 million FY2025 | 6.8% | 5.3% | -23.0% |
| Generation Income Properties Inc. (GIPR) | $10 million FY2025 | -0.2% | -71.7% | -106.2% |
| Manhattan Bridge Capital Inc (LOAN) | $9 million FY2025 | -10.6% | 58.8% | 59.0% |
| InnSuites Hospitality Trust (IHT) | $8 million FY2026 | -0.4% | -7.4% | -18.8% |
| Power REIT (MD) (PW) | $2 million FY2025 | -34.0% | n/a | -109.4% |
| Rithm Property Trust Inc. (RPT) | -$55 million FY2024 | n/a | n/a | n/a |
Revenue growth compares each company's latest fiscal year with the one before. Fiscal years do not always end on the same date, so treat close comparisons with care.
How Does Iron Mountain Rank Among All SEC Filers in Its Industry Code?
111 companies with annual reports in Swoopr's SEC dataset share SIC code 6798 (Real Estate Investment Trusts), a wider group than the S&P 500 Equal Weight companies above. Ranks run from 1 (highest) and use each company's latest fiscal year, in U.S. dollars.
| Measure | Iron Mountain | Median of filers | Rank |
|---|---|---|---|
| Revenue | $6.9 billion | $729 million | 6 of 111 |
| Revenue growth | 12.2% | 2.9% | 17 of 109 |
| Operating margin | 16.9% | 20.0% | 33 of 57 |
| Net margin | 2.2% | 10.4% | 73 of 111 |
A SIC code reflects the filer's main business as the SEC records it, so the group mixes companies of very different size; the median is a better guide than the average, and a rank near the top by revenue says nothing about quality.
Where These Numbers Come From
Every figure on this page is a value Iron Mountain reported in its own SEC filings, read from the SEC's XBRL data (accession 0001020569-26-000013 for fiscal year 2025). Ratios are computed from those reported values. Figures were retrieved on October 7, 2026; a later amendment or a new annual report can change them, and the filing itself always takes precedence over this summary.
Each fiscal year is labeled by the calendar year in which it ended, so a company that names the same period differently in its own filings (many retailers whose year ends in January) may use another label. A year is left out of the table when the SEC data set holds no value for it. A figure shown as "Not reported" means the company did not file a value under the standard tag Swoopr reads, not that the amount was zero. This page is educational and describes reported history only; it is not a forecast or a recommendation.
Frequently Asked Questions
Who are Iron Mountain's competitors?
Companies sharing Iron Mountain's SEC classification (SIC code 6798 (Real Estate Investment Trusts)) include Welltower (WELL), American Tower (AMT), Equinix (EQIX), Prologis (PLD), Weyerhaeuser (WY). Its 10-K names the competitors it considers most relevant.
How does Iron Mountain compare with its peers on margins?
Iron Mountain's fiscal 2025 operating margin was 16.9%, against a peer median of 20.5%.
How are these peers chosen?
By the SEC Standard Industrial Classification code each company files under, within Swoopr's S&P 500 Equal Weight company set, falling back to the two-digit major group when fewer than two companies share the exact code. Classification codes are broad, so read the peer list as a screen, not a verdict.
How does Iron Mountain rank among all companies in its SEC industry?
Among 111 SEC filers under SIC code 6798, Iron Mountain ranks 6 by latest revenue, and 33 of 57 by operating margin (16.9% against a median of 20.0%).