
Direct Answer
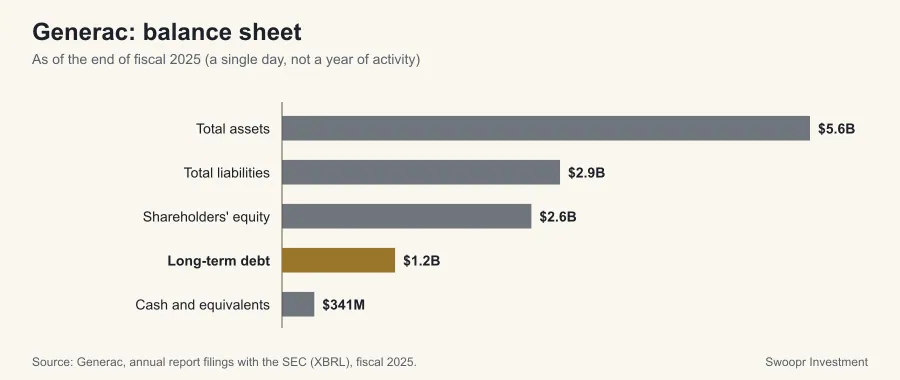
Generac's fiscal 2025 filings show no reading on these measures that stands out from common thresholds. These figures measure financial risk only; the business risks Generac itself considers material are listed under Item 1A, Risk Factors, of its Form 10-K, most recently filed February 18, 2026.
What Do Generac's Financial Risk Indicators Show?
| Indicator (fiscal 2025) | Generac | Peer median (same SIC code) | What it measures |
|---|---|---|---|
| Liabilities to assets | 53% | 33% | How much of the balance sheet is funded by obligations rather than equity. |
| Current ratio | 2.0x | 1.9x | Short-term assets per dollar of obligations due within a year. |
| Interest coverage | 4.1x | n/a | Operating income per dollar of interest expense. |
| Long-term debt to operating cash flow | 2.7x | n/a | Years of operating cash flow it would take to repay long-term debt. |
| Net debt | $852 million | n/a | Long-term debt minus cash; negative means more cash than long-term debt. |
The peer median uses 2 other companies in Swoopr's S&P 500 Equal Weight set that share the same SEC SIC code. A reading worse than the peer median is a prompt to read the filing, not a conclusion.
Where Are Generac's Official Risk Factors?
The risks Generac considers material are disclosed in Item 1A of its Form 10-K, most recently filed February 18, 2026. Read them with three questions in mind: which risks are specific to this company rather than generic, which have changed since the prior year's filing, and which connect to the figures above (a refinancing risk matters more when interest coverage is thin).
Where These Numbers Come From
Every figure on this page is a value Generac reported in its own SEC filings, read from the SEC's XBRL data (accession 0001437749-26-004568 for fiscal year 2025). Ratios are computed from those reported values. Figures were retrieved on October 7, 2026; a later amendment or a new annual report can change them, and the filing itself always takes precedence over this summary.
Each fiscal year is labeled by the calendar year in which it ended, so a company that names the same period differently in its own filings (many retailers whose year ends in January) may use another label. A year is left out of the table when the SEC data set holds no value for it. A figure shown as "Not reported" means the company did not file a value under the standard tag Swoopr reads, not that the amount was zero. This page is educational and describes reported history only; it is not a forecast or a recommendation.
Frequently Asked Questions
Is Generac highly leveraged?
At the end of fiscal 2025, Generac's total liabilities were 53% of total assets, against a peer median of 33%. Leverage that is normal for one industry (banks, utilities) can be high for another.
Where are Generac's official risk factors?
In Item 1A, Risk Factors, of its annual report on Form 10-K, most recently filed with the SEC on February 18, 2026. The company lists the risks it considers material there; the measures on this page only quantify the financial side.
Can Generac pay its interest?
In fiscal 2025, operating income covered interest expense 4.1x. Coverage below about 3x leaves little room if earnings fall.