
Direct Answer
SEC EDGAR classifies GE HealthCare under SIC major group 38. Among Swoopr's S&P 500 Equal Weight companies, 191 others share that classification; by latest reported revenue, GE HealthCare ranks 10 of 192. A filing classification is a starting point: a company's real competitors depend on its segments, which its 10-K describes.
How Does GE HealthCare Compare With Its Peers?
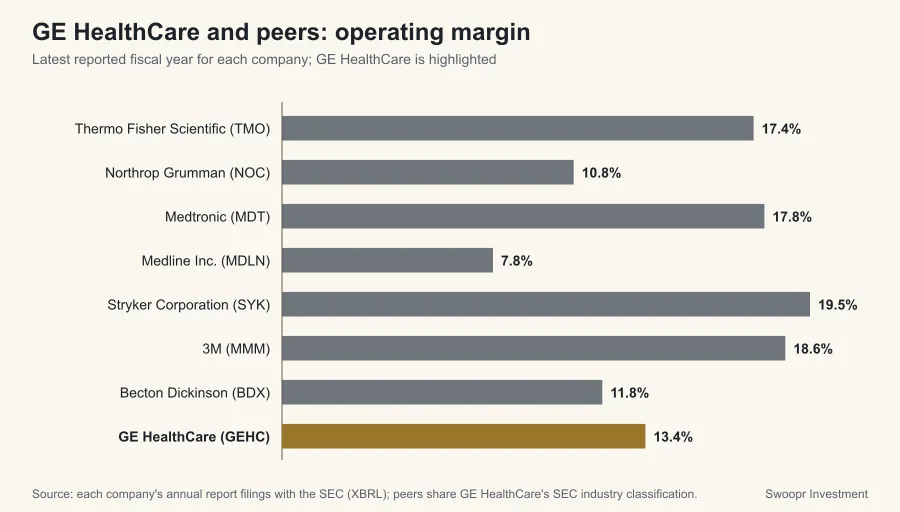
| Company | Revenue (latest FY) | Revenue growth | Operating margin | Net margin |
|---|---|---|---|---|
| Thermo Fisher Scientific (TMO) | $44.6 billion FY2025 | 3.9% | 17.4% | 15.1% |
| Northrop Grumman (NOC) | $42.0 billion FY2025 | 2.2% | 10.8% | 10.0% |
| Medtronic (MDT) | $36.4 billion FY2026 | 8.4% | 17.8% | 0.0% |
| Medline Inc. (MDLN) | $28.4 billion FY2025 | 11.5% | 7.8% | 4069.4% |
| Stryker Corporation (SYK) | $25.1 billion FY2025 | 11.2% | 19.5% | 12.9% |
| 3M (MMM) | $24.9 billion FY2025 | 1.5% | 18.6% | 13.0% |
| Becton Dickinson (BDX) | $21.8 billion FY2025 | 8.2% | 11.8% | 7.7% |
| L3Harris (LHX) | $21.3 billion FY2024 | 9.8% | 9.0% | 7.0% |
| Trane Technologies (TT) | $21.3 billion FY2025 | 7.5% | 18.6% | 13.7% |
| GE HealthCare (GEHC) | $20.6 billion FY2025 | 4.8% | 13.4% | 10.1% |
| Boston Scientific (BSX) | $20.1 billion FY2025 | 19.9% | 18.0% | 14.4% |
| KLA (KLAC) | $12.2 billion FY2025 | 23.9% | n/a | 33.4% |
| Baxter International (BAX) | $11.2 billion FY2025 | 5.7% | -2.7% | -8.5% |
| Intuitive Surgical (ISRG) | $10.1 billion FY2025 | 20.5% | 29.3% | 28.4% |
| Rockwell Automation (ROK) | $8.3 billion FY2025 | 0.9% | 20.4% | 10.4% |
| Solventum (SOLV) | $8.3 billion FY2025 | 0.9% | 26.2% | 18.7% |
| Zimmer Biomet (ZBH) | $8.2 billion FY2025 | 7.2% | 13.3% | 8.6% |
| Roper Technologies (ROP) | $7.9 billion FY2025 | 12.3% | 28.3% | 19.4% |
| Ametek (AME) | $7.4 billion FY2025 | 6.6% | 25.8% | 20.0% |
| Garmin (GRMN) | $7.2 billion FY2025 | 15.1% | 25.9% | 23.0% |
| Agilent Technologies (A) | $6.9 billion FY2025 | 6.7% | 21.3% | 18.8% |
| Avantor Inc. (AVTR) | $6.6 billion FY2025 | -3.4% | -3.8% | -8.1% |
| Teledyne Technologies (TDY) | $6.1 billion FY2025 | 7.9% | 18.8% | 14.6% |
| Edwards Lifesciences (EW) | $6.1 billion FY2025 | 11.5% | 20.8% | 17.7% |
| Steris (STE) | $5.9 billion FY2026 | 8.7% | 18.6% | 13.2% |
| Coherent Corp. (COHR) | $5.8 billion FY2025 | 23.4% | n/a | 0.5% |
| Veralto (VLTO) | $5.5 billion FY2025 | 6.0% | 23.2% | 17.1% |
| Keysight Technologies (KEYS) | $5.4 billion FY2025 | 8.0% | 16.3% | 15.8% |
| ResMed (RMD) | $5.1 billion FY2025 | 9.8% | 32.7% | 27.2% |
| Dexcom (DXCM) | $4.7 billion FY2025 | 15.6% | 19.6% | 17.9% |
| Illumina Inc. (ILMN) | $4.3 billion FY2025 | -0.7% | 18.6% | 19.6% |
| Fortive (FTV) | $4.2 billion FY2025 | 1.9% | 17.3% | 12.8% |
| Cooper Companies (COO) | $4.1 billion FY2025 | 5.1% | 16.7% | 9.2% |
| Align Technology (ALGN) | $4.0 billion FY2025 | 0.9% | 13.5% | 10.2% |
| Mettler Toledo (MTD) | $4.0 billion FY2025 | 4.0% | n/a | 21.6% |
| MKS Inc. (MKSI) | $3.9 billion FY2025 | 9.6% | 13.4% | 7.5% |
| DENTSPLY SIRONA Inc. (XRAY) | $3.7 billion FY2025 | -3.0% | -11.5% | -16.3% |
| Trimble Inc. (TRMB) | $3.6 billion FY2025 | -2.6% | 16.5% | 11.8% |
| Bruker Corporation (BRKR) | $3.4 billion FY2025 | 2.1% | 2.0% | -0.2% |
| Teradyne (TER) | $3.2 billion FY2025 | 13.1% | 20.4% | 17.4% |
| Waters Corporation (WAT) | $3.2 billion FY2025 | 7.0% | 25.4% | 20.3% |
| MiniMed Group Inc. (MMED) | $3.1 billion FY2026 | 14.3% | -6.1% | -10.7% |
| Vontier Corporation (VNT) | $3.1 billion FY2025 | 3.2% | 18.3% | 13.2% |
| West Pharmaceutical Services (WST) | $3.1 billion FY2025 | 6.3% | 19.0% | 16.1% |
| Globus Medical Inc. (GMED) | $2.9 billion FY2025 | 16.7% | 16.3% | 18.3% |
| Revvity (RVTY) | $2.9 billion FY2025 | 3.7% | 12.5% | 8.4% |
| Envista Holdings Corporation (NVST) | $2.7 billion FY2025 | 8.3% | 7.9% | 1.7% |
| Insulet Corporation (PODD) | $2.7 billion FY2025 | 30.7% | 17.5% | 9.1% |
| Bio-Rad Laboratories Inc. (BIO) | $2.6 billion FY2025 | 0.7% | 1.8% | 29.4% |
| MSA Safety Incorporated (MSA) | $1.9 billion FY2025 | 3.7% | 19.8% | 14.9% |
| Penumbra Inc. (PEN) | $1.4 billion FY2025 | 17.5% | 13.5% | 12.7% |
| Haemonetics Corporation (HAE) | $1.3 billion FY2026 | -2.0% | 11.7% | 0.0% |
| Embecta Corp. (EMBC) | $1.1 billion FY2025 | -3.8% | 22.4% | 8.8% |
| Eastman Kodak Company (KODK) | $1.1 billion FY2025 | 2.5% | 0.0% | -12.0% |
| Onto Innovation Inc. (ONTO) | $1.0 billion FY2025 | 1.8% | 13.2% | 0.0% |
| Fossil Group Inc. (FOSL) | $1.0 billion FY2025 | -12.3% | -1.9% | -7.7% |
| Cognex Corporation (CGNX) | $994 million FY2025 | 8.7% | 16.3% | 11.5% |
| Alphatec Holdings Inc. (ATEC) | $764 million FY2025 | 25.0% | -10.7% | -18.8% |
| iRhythm Holdings Inc. (IRTC) | $747 million FY2025 | 26.2% | -7.7% | -6.0% |
| Movado Group Inc. (MOV) | $671 million FY2026 | 2.7% | 4.4% | 4.0% |
| GoPro Inc. (GPRO) | $652 million FY2025 | -18.7% | -12.8% | -14.3% |
| 10x Genomics Inc. (TXG) | $643 million FY2025 | 5.2% | -9.5% | -6.8% |
| Cadre Holdings Inc. (CDRE) | $610 million FY2025 | 7.5% | 11.0% | 7.2% |
| Bioventus Inc. (BVS) | $568 million FY2025 | -0.9% | 9.5% | 4.0% |
| Allient Inc. (ALNT) | $554 million FY2025 | 4.6% | 7.9% | 4.0% |
| AtriCure Inc. (ATRC) | $535 million FY2025 | 14.9% | -1.8% | -2.1% |
| Accuray Incorporated (ARAY) | $459 million FY2025 | 2.7% | 1.7% | -0.3% |
| MiMedx Group Inc (MDXG) | $419 million FY2025 | 20.0% | 15.3% | 11.6% |
| Inogen Inc (INGN) | $349 million FY2025 | 3.9% | -8.7% | 6.5% |
| Transcat Inc. (TRNS) | $332 million FY2026 | 19.2% | 4.0% | 1.6% |
| Tactile Systems Technology Inc. (TCMD) | $330 million FY2025 | 12.5% | 8.9% | 5.8% |
| AngioDynamics Inc. (ANGO) | $320 million FY2026 | 9.5% | -12.5% | -11.5% |
| PROCEPT BioRobotics Corporation (PRCT) | $308 million FY2025 | 37.2% | -33.7% | -0.0% |
| SkinHealth Systems Inc. (SKIN) | $301 million FY2025 | -10.0% | -6.9% | -3.2% |
| Kewaunee Scientific Corporation (KEQU) | $282 million FY2026 | 17.3% | 5.9% | 3.4% |
| Mesa Laboratories Inc. (MLAB) | $249 million FY2026 | 3.4% | 7.4% | 2.7% |
| OrthoPediatrics Corp. (KIDS) | $236 million FY2025 | 15.4% | -16.6% | -16.8% |
| Cerus Corporation (CERS) | $234 million FY2025 | 16.1% | -3.7% | -6.7% |
| Axogen Inc. (AXGN) | $225 million FY2025 | 20.2% | -3.5% | -7.0% |
| Treace Medical Concepts Inc. (TMCI) | $213 million FY2025 | 1.6% | -25.5% | -27.7% |
| Intuitive Machines Inc. (LUNR) | $210 million FY2025 | -7.9% | -41.5% | -39.7% |
| Cytek Biosciences Inc. (CTKB) | $201 million FY2025 | 0.5% | -20.0% | -33.0% |
| SI-BONE Inc. (SIBN) | $201 million FY2025 | 20.2% | -11.1% | -9.4% |
| Lakeland Industries Inc. (LAKE) | $193 million FY2026 | 15.2% | -8.1% | -13.1% |
| Hurco Companies Inc. (HURC) | $179 million FY2025 | -4.3% | -5.8% | -8.5% |
| Heartflow Inc. (HTFL) | $176 million FY2025 | 39.9% | -36.4% | -66.3% |
| Pacific Biosciences of California Inc. (PACB) | $160 million FY2025 | 3.9% | -346.2% | -341.5% |
| Neuronetics Inc. (STIM) | $149 million FY2025 | 99.2% | -21.1% | -26.1% |
| InfuSystems Holdings Inc. (INFU) | $143 million FY2025 | 6.4% | 8.3% | 4.6% |
| Quanterix Corporation (QTRX) | $139 million FY2025 | 1.1% | -90.4% | -77.2% |
| RxSight Inc. (RXST) | $134 million FY2025 | -3.9% | -35.8% | -0.0% |
| Xtant Medical Holdings Inc. (XTNT) | $134 million FY2025 | 14.2% | 5.4% | 0.0% |
| Sypris Solutions Inc. (SYPR) | $120 million FY2025 | -14.5% | -5.5% | -0.0% |
| Outset Medical Inc. (OM) | $119 million FY2025 | 5.1% | -55.8% | -68.3% |
| OraSure Technologies Inc. (OSUR) | $115 million FY2025 | -38.1% | -62.6% | -59.8% |
| inTest Corporation (INTT) | $114 million FY2025 | -12.9% | -3.3% | -2.2% |
| Anika Therapeutics Inc. (ANIK) | $113 million FY2025 | -5.9% | -9.8% | -9.8% |
| Geospace Technologies Corporation (GEOS) | $111 million FY2025 | -18.3% | -10.2% | -8.8% |
| Owlet Inc. (OWLT) | $106 million FY2025 | 37.1% | -7.0% | -36.6% |
| Sanara MedTech Inc. (SMTI) | $103 million FY2025 | 19.0% | 7.1% | 36.4% |
| Beta Bionics Inc. (BBNX) | $100 million FY2025 | 53.9% | -71.5% | -73.0% |
| Neuropace Inc. (NPCE) | $100 million FY2025 | 25.1% | -16.3% | -21.5% |
| Butterfly Network Inc. (BFLY) | $98 million FY2025 | 19.0% | -88.5% | -79.0% |
| Kestra Medical Technologies Ltd. (KMTS) | $95 million FY2026 | 59.0% | -141.6% | -138.4% |
| Pulmonx Corporation (LUNG) | $90 million FY2025 | 8.0% | -59.3% | -59.7% |
| CeriBell Inc. (CBLL) | $89 million FY2025 | 36.1% | -65.6% | -60.0% |
| Harvard Bioscience Inc. (HBIO) | $87 million FY2025 | -8.1% | -56.1% | -65.5% |
| Delcath Systems Inc. (DCTH) | $85 million FY2025 | 129.1% | 0.8% | 3.2% |
| iRadimed Corporation (IRMD) | $84 million FY2025 | 14.4% | 31.2% | 26.8% |
| TELA Bio Inc. (TELA) | $80 million FY2025 | 15.8% | -42.0% | -48.3% |
| Sight Sciences Inc. (SGHT) | $77 million FY2025 | -3.1% | -48.0% | -49.7% |
| Avita Medical Inc. (RCEL) | $72 million FY2025 | 11.5% | -59.4% | -67.8% |
| Pro-Dex Inc. (PDEX) | $67 million FY2025 | 23.7% | 16.1% | 13.5% |
| Electromed Inc. (ELMD) | $64 million FY2025 | 17.0% | 15.1% | 11.8% |
| Frequency Electronics Inc. (FEIM) | $63 million FY2026 | -9.4% | -4.7% | -0.0% |
| LENSAR Inc. (LNSR) | $58 million FY2025 | 9.2% | -42.1% | -58.7% |
| CVRx Inc. (CVRX) | $57 million FY2025 | 10.4% | -90.5% | -94.1% |
| 908 Devices Inc. (MASS) | $56 million FY2025 | 17.7% | -70.1% | 34.7% |
| Apyx Medical Corporation (APYX) | $53 million FY2025 | 9.9% | -12.2% | -21.2% |
| IRIDEX Corporation (IRIX) | $53 million FY2025 | 8.2% | -4.9% | -8.4% |
| Carlsmed Inc. (CARL) | $51 million FY2025 | 85.9% | -60.5% | -58.7% |
| Aehr Test Systems (AEHR) | $50 million FY2026 | -15.2% | -28.3% | -14.3% |
| Shoulder Innovations Inc. (SI) | $47 million FY2025 | 49.6% | -55.6% | -85.3% |
| TriSalus Life Sciences Inc. (TLSI) | $45 million FY2025 | 53.4% | -59.7% | -86.9% |
| SANUWAVE Health Inc. (SNWV) | $44 million FY2025 | 35.0% | 11.2% | 26.8% |
| Optex Systems Holdings Inc. (OPXS) | $41 million FY2025 | 21.6% | 17.3% | 12.5% |
| KORU Medical Systems Inc. (KRMD) | $41 million FY2025 | 22.2% | -7.2% | -6.4% |
| MIND Technology Inc. (MIND) | $41 million FY2026 | -12.6% | 7.0% | 1.8% |
| Myomo Inc. (MYO) | $41 million FY2025 | 25.7% | -35.2% | -38.1% |
| Utah Medical Products Inc. (UTMD) | $39 million FY2025 | -5.8% | 29.6% | 29.3% |
| Retractable Technologies Inc. (RVP) | $38 million FY2025 | 15.8% | -55.3% | -32.8% |
| Cytosorbents Corporation (CTSO) | $37 million FY2025 | 4.1% | -39.8% | -22.1% |
| ClearPoint Neuro Inc. (CLPT) | $37 million FY2025 | 17.8% | -65.4% | -69.1% |
| Senseonics Holdings Inc. (SENS) | $35 million FY2025 | 56.9% | -193.8% | -196.0% |
| Rapid Micro Biosystems Inc. (RPID) | $34 million FY2025 | 19.7% | -141.1% | -140.3% |
| Orchestra BioMed Holdings Inc. (OBIO) | $33 million FY2025 | 1169.2% | -154.7% | -157.4% |
| Stereotaxis Inc. (STXS) | $32 million FY2025 | 20.3% | -68.3% | -66.8% |
| electroCore Inc. (ECOR) | $32 million FY2025 | 27.2% | -41.1% | -43.6% |
| EyePoint Inc. (EYPT) | $31 million FY2025 | -27.5% | -776.0% | -739.4% |
| Bionano Genomics Inc. (BNGO) | $29 million FY2025 | -7.4% | -116.9% | -92.6% |
| Syntec Optics Holdings Inc. (OPTX) | $28 million FY2025 | -1.3% | -1.8% | -6.4% |
| Sensus Healthcare Inc. (SRTS) | $27 million FY2025 | -34.3% | -37.5% | -28.1% |
| Coda Octopus Group Inc. (CODA) | $27 million FY2025 | 30.7% | 17.1% | 15.5% |
| Precipio Inc. (PRPO) | $24 million FY2025 | 29.8% | -5.0% | -1.5% |
| Data I/O Corporation (DAIO) | $22 million FY2025 | -1.2% | -23.8% | -24.4% |
| Spectral AI Inc. (MDAI) | $20 million FY2025 | -33.6% | -43.8% | -38.5% |
| Sonoma Pharmaceuticals Inc. (SNOA) | $20 million FY2026 | 36.7% | -12.6% | 0.0% |
| Precision Optics Corporation Inc. (POCI) | $19 million FY2025 | -0.1% | -29.1% | -30.3% |
| QT Imaging Holdings Inc. (QTI) | $19 million FY2025 | 287.9% | -23.4% | -111.4% |
| Nephros Inc. (NEPH) | $19 million FY2025 | 32.7% | 6.1% | 6.4% |
| Moving iMage Technologies Inc. (MITQ) | $18 million FY2025 | -9.9% | -6.0% | -5.2% |
| Vivos Therapeutics Inc. (VVOS) | $17 million FY2025 | 16.0% | -114.1% | -121.4% |
| Seer Inc. (SEER) | $17 million FY2025 | 17.0% | -470.5% | -444.0% |
| Hyperfine Inc. (HYPR) | $14 million FY2025 | 5.2% | -273.4% | -262.3% |
| CapsoVision Inc. (CV) | $14 million FY2025 | 15.3% | -188.3% | -186.8% |
| NexGel Inc (NXGL) | $11 million FY2025 | 31.5% | -29.3% | -26.3% |
| NeuroOne Medical Technologies Corporation (NMTC) | $9 million FY2025 | 163.5% | -46.5% | -39.6% |
| Milestone Scientific Inc. (MLSS) | $9 million FY2025 | 4.0% | -63.5% | 63.8% |
| Nuwellis Inc. (NUWE) | $8 million FY2025 | -5.4% | -134.3% | -211.9% |
| Beyond Air Inc. (XAIR) | $8 million FY2026 | 107.3% | -378.2% | -433.0% |
| INVO Fertility Inc. (IVF) | $7 million FY2025 | 4.7% | -105.8% | 340.9% |
| MultiSensor AI Holdings Inc. (MSAI) | $6 million FY2025 | -25.0% | -216.4% | -211.0% |
| ClearSign Technologies Corporation (CLIR) | $5 million FY2025 | 45.6% | -127.5% | -105.0% |
| Cerenome Inc. (CNSY) | $5 million FY2025 | -10.5% | -293.5% | -429.4% |
| Lucid Diagnostics Inc. (LUCD) | $5 million FY2025 | 8.3% | -1054.8% | -1232.7% |
| NextNav Inc. (NN) | $5 million FY2025 | -19.3% | -1535.8% | -4138.5% |
| Tenon Medical Inc. (TNON) | $4 million FY2025 | 20.4% | -324.3% | -318.4% |
| Neuraxis Inc. (NRXS) | $4 million FY2025 | 32.9% | -219.4% | -218.5% |
| Intelligent Bio Solutions Inc. (INBS) | $3 million FY2025 | -1.9% | -349.8% | -346.2% |
| Innovative Eyewear Inc. (LUCY) | $3 million FY2025 | 62.6% | n/a | -285.2% |
| ENvue Medical Inc. (FEED) | $3 million FY2025 | -0.2% | -896.6% | -712.3% |
| Quantum-Si Incorporated (QSI) | $2 million FY2025 | -20.3% | -4766.0% | -4160.1% |
| Femasys Inc. (FEMY) | $2 million FY2025 | 40.8% | -767.0% | -812.3% |
| Nutriband Inc. (NTRB) | $2 million FY2026 | -4.8% | -408.4% | -404.1% |
| Anteris Technologies Global Corp. (AVR) | $2 million FY2025 | -29.2% | -4908.2% | -4921.3% |
| SeaStar Medical Holding Corporation (ICU) | $1 million FY2025 | 814.1% | -986.6% | -984.6% |
| RenovoRx Inc. (RNXT) | $1 million FY2025 | 2511.6% | -1114.0% | -994.5% |
| SiNtx Technologies Inc. (SINT) | $1 million FY2025 | -64.7% | -1053.1% | -1018.1% |
| Astrotech Corporation (ASTC) | $1 million FY2025 | -41.2% | -1473.4% | -1385.0% |
| Co-Diagnostics Inc. (CODX) | $622,489 FY2025 | -84.1% | -8058.8% | -7550.3% |
| Pulse Biosciences Inc (PLSE) | $350,000 FY2025 | n/a | -21982.6% | -20794.6% |
| Nexalin Technology Inc. (NXL) | $301,647 FY2025 | 78.8% | -2781.7% | -2725.8% |
| Focus Universal Inc. (FCUV) | $255,023 FY2025 | -35.9% | -1918.8% | -1877.4% |
| Bluejay Diagnostics Inc. (BJDX) | $249,040 FY2022 | n/a | -3741.5% | -3733.1% |
| Envoy Medical Inc. (COCH) | $241,000 FY2025 | 7.1% | -9240.7% | -9857.3% |
| Profusa Inc. (PFSA) | $100,000 FY2024 | n/a | -4500.0% | -9230.0% |
| PAVmed Inc. (PAVM) | $71,000 FY2025 | -97.6% | -30712.7% | -5315.5% |
| Adagio Medical Holdings Inc (ADGM) | $0 FY2025 | n/a | n/a | n/a |
| Aethlon Medical Inc. (AEMD) | $0 FY2024 | -100.0% | n/a | n/a |
| Autonomix Medical Inc. (AMIX) | $0 FY2026 | n/a | n/a | n/a |
| Fractyl Health Inc. (GUTS) | $0 FY2025 | -100.0% | n/a | n/a |
| Vivani Medical Inc. (VANI) | $0 FY2025 | n/a | n/a | n/a |
Revenue growth compares each company's latest fiscal year with the one before. Fiscal years do not always end on the same date, so treat close comparisons with care.
Where These Numbers Come From
Every figure on this page is a value GE HealthCare reported in its own SEC filings, read from the SEC's XBRL data (accession 0001932393-26-000007 for fiscal year 2025). Ratios are computed from those reported values. Figures were retrieved on October 12, 2026; a later amendment or a new annual report can change them, and the filing itself always takes precedence over this summary.
Each fiscal year is labeled by the calendar year in which it ended, so a company that names the same period differently in its own filings (many retailers whose year ends in January) may use another label. A year is left out of the table when the SEC data set holds no value for it. A figure shown as "Not reported" means the company did not file a value under the standard tag Swoopr reads, not that the amount was zero. This page is educational and describes reported history only; it is not a forecast or a recommendation.
Frequently Asked Questions
Who are GE HealthCare's competitors?
Companies sharing GE HealthCare's SEC classification (SIC major group 38) include Thermo Fisher Scientific (TMO), Northrop Grumman (NOC), Medtronic (MDT), Medline Inc. (MDLN), Stryker Corporation (SYK). Its 10-K names the competitors it considers most relevant.
How does GE HealthCare compare with its peers on margins?
GE HealthCare's fiscal 2025 operating margin was 13.4%, against a peer median of -8.4%.
How are these peers chosen?
By the SEC Standard Industrial Classification code each company files under, within Swoopr's S&P 500 Equal Weight company set, falling back to the two-digit major group when fewer than two companies share the exact code. Classification codes are broad, so read the peer list as a screen, not a verdict.