
Direct Answer
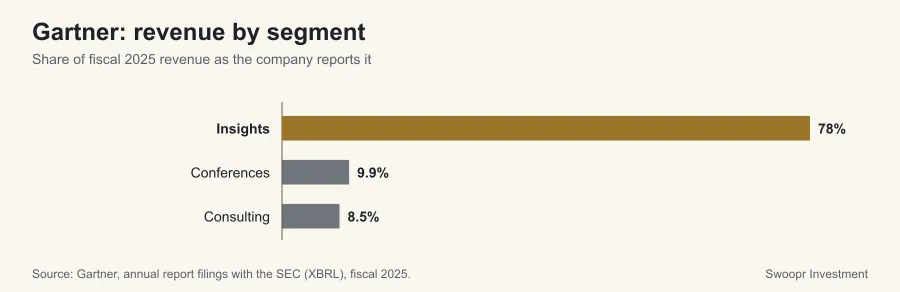
Gartner reports revenue across 3 business segments in its fiscal 2025 Form 10-K. Insights is the largest, with $5.1 billion of revenue (78% of the total), followed by Conferences at $645 million (10%).
How Does Gartner Make Money?
Insights supplies 78% of revenue, so Gartner's results move mostly with that one business; the others matter more for diversification than for the headline number. Between fiscal 2024 and 2025, Conferences grew fastest (+10.5%) and Consulting slowest (-1.1%), so the revenue mix tilts toward Conferences while that gap lasts.
| Segment | FY2025 revenue | FY2024 revenue | Share of revenue | Change |
|---|---|---|---|---|
| Insights | $5.1 billion | $4.8 billion | 78.1% | 5.0% |
| Conferences | $645 million | $583 million | 9.9% | 10.5% |
| Consulting | $552 million | $559 million | 8.5% | -1.1% |
What Does Gartner Sell?
Gartner also breaks revenue down by product and service line, which shows what customers pay for rather than how management organizes the business.
| Product or service | FY2025 revenue | FY2024 revenue | Share of revenue | Change |
|---|---|---|---|---|
| Insights | $5.1 billion | $4.8 billion | 78.1% | 5.0% |
| Conferences | $645 million | $583 million | 9.9% | 10.5% |
| Consulting | $552 million | $559 million | 8.5% | -1.1% |
| Product and Service Other | $227 million | $297 million | 3.5% | -23.3% |
Where Does Gartner's Revenue Come From?
Regions follow the definitions in the filing; most companies assign revenue by customer location.
| Region | FY2025 revenue | FY2024 revenue | Share of revenue | Change |
|---|---|---|---|---|
| United States and Canada | $4.0 billion | $4.0 billion | 62.1% | 0.4% |
| Europe Middle East Africa | $1.7 billion | $1.5 billion | 26.1% | 11.6% |
| Other International | $771 million | $732 million | 11.9% | 5.3% |
What the Segment Figures Do Not Show
The rows above add up to 96% of Gartner's reported revenue for fiscal 2025; the difference is intersegment eliminations, corporate revenue or items the company reports outside its segments. Segment definitions are management's choice and change when a company reorganizes, in which case it restates prior years in the next filing, so a multi-year comparison should use the figures from a single filing. Revenue shows where sales come from, not where profit or cash is earned: a small segment can carry most of the margin.
Where These Numbers Come From
Every figure on this page is a value Gartner reported in the segment note and revenue disclosures of its Form 10-K filed February 12, 2026 (accession 0000749251-26-000112), read from the SEC's Financial Statement Data Sets. The prior-year column is the comparative figure from that same filing, so it reflects any restatement for a change in segments. Category names are the company's own XBRL labels, lightly reformatted for reading.
Rows that only total other rows (for example a "Products" line beside the individual products) are left out so nothing is counted twice. This page is educational and describes reported history for fiscal 2025; it is not a forecast or a recommendation.
Frequently Asked Questions
What are Gartner's business segments?
In its fiscal 2025 Form 10-K, Gartner reports revenue for Insights, Conferences and Consulting.
Which part of Gartner brings in the most revenue?
Insights, with $5.1 billion of revenue in fiscal 2025, or 78% of the total.
Where does Gartner report its segment results?
In the segment note to the financial statements in its Form 10-K, most recently filed February 12, 2026, alongside management's discussion of each segment's results.