
Direct Answer
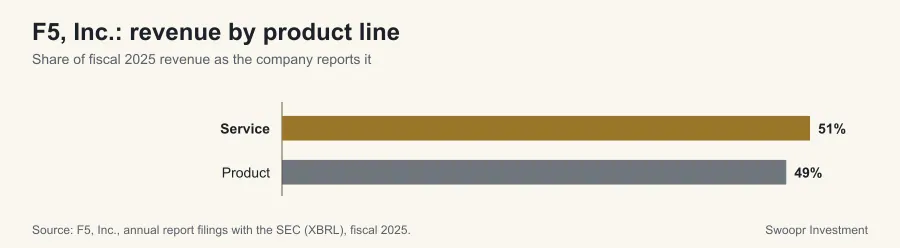
F5, Inc. reports revenue across 2 product and service lines in its fiscal 2025 Form 10-K. Service is the largest, with $1.6 billion of revenue (51% of the total), followed by Product at $1.5 billion (49%). 53% of revenue came from the United States.
How Does F5, Inc. Make Money?
No single line supplies a majority of revenue: the largest, Service, is 51%, which spreads F5, Inc.'s exposure across several demand drivers. Between fiscal 2024 and 2025, Product grew fastest (+18.5%) and Service slowest (+2.3%), so the revenue mix tilts toward Product while that gap lasts.
| Product or service | FY2025 revenue | FY2024 revenue | Share of revenue | Change |
|---|---|---|---|---|
| Service | $1.6 billion | $1.5 billion | 51.1% | 2.3% |
| Product | $1.5 billion | $1.3 billion | 48.9% | 18.5% |
Where Does F5, Inc.'s Revenue Come From?
Regions follow the definitions in the filing; most companies assign revenue by customer location.
| Region | FY2025 revenue | FY2024 revenue | Share of revenue | Change |
|---|---|---|---|---|
| United States | $1.6 billion | $1.5 billion | 52.8% | 9.6% |
| EMEA | $827 million | $756 million | 26.8% | 9.4% |
| Asia Pacific | $537 million | $479 million | 17.4% | 12.1% |
| Other Americas | $93 million | $93 million | 3.0% | 0.0% |
What the Segment Figures Do Not Show
The rows above add up to 100% of F5, Inc.'s reported revenue for fiscal 2025; the difference is intersegment eliminations, corporate revenue or items the company reports outside its segments. Segment definitions are management's choice and change when a company reorganizes, in which case it restates prior years in the next filing, so a multi-year comparison should use the figures from a single filing. Revenue shows where sales come from, not where profit or cash is earned: a small segment can carry most of the margin.
Where These Numbers Come From
Every figure on this page is a value F5, Inc. reported in the segment note and revenue disclosures of its Form 10-K filed November 25, 2025 (accession 0001048695-25-000157), read from the SEC's Financial Statement Data Sets. The prior-year column is the comparative figure from that same filing, so it reflects any restatement for a change in segments. Category names are the company's own XBRL labels, lightly reformatted for reading.
Rows that only total other rows (for example a "Products" line beside the individual products) are left out so nothing is counted twice. This page is educational and describes reported history for fiscal 2025; it is not a forecast or a recommendation.
Frequently Asked Questions
What are F5, Inc.'s main products and services?
In its fiscal 2025 Form 10-K, F5, Inc. reports revenue for Service and Product.
Which part of F5, Inc. brings in the most revenue?
Service, with $1.6 billion of revenue in fiscal 2025, or 51% of the total.
How much of F5, Inc.'s revenue comes from outside the United States?
47% in fiscal 2025, by the geographic breakdown F5, Inc. reports in its Form 10-K. Companies assign revenue to regions differently (customer location, shipping address or selling entity), so check the filing's definition before comparing companies.